Application Exercises
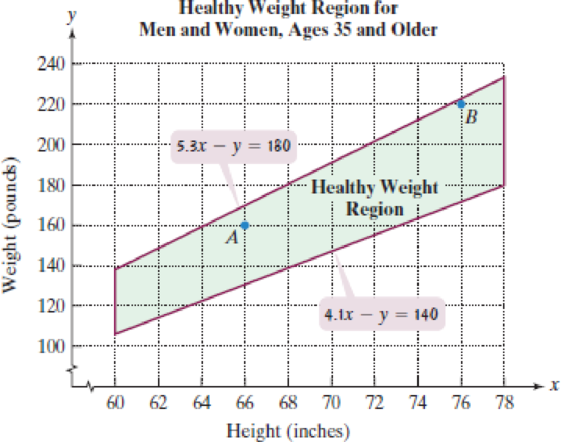
The figure shows the healthy weight region for various heights for people ages 35 and older.

Source: U.S. Department of Health and Human Services
If x represents height, in inches, and y represents weight, in pounds, the healthy weight region can be modeled by the following system of linear inequalities:
Use this information to solve Exercises 77–80.
78. Show that point B is a solution of the system of inequalities that describes healthy weight for this age group.
Want to see the full answer?
Check out a sample textbook solution
Chapter 5 Solutions
College Algebra Essentials (5th Edition)
- Listen MODELING REAL LIFE Your checking account has a constant balance of $500. Let the function m represent the balance of your savings account after t years. The table shows the total balance of the accounts over time. Year, t Total balance 0 $2500 1 $2540 2 $2580.80 3 $2622.42 4 $2664.86 5 $2708.16 a. Write a function B that represents the total balance after t years. Round values to the nearest hundredth, if necessary. B(t) = 500 + 2000(1.02)* b. Find B(8). About $2843.32 Interpret B(8). B I U E T² T₂ c. Compare the savings account to the account, You deposit $9000 in a savings account that earns 3.6% annual interest compounded monthly. B I U E E T² T₂ A = 11998.70 SINCE 9000 is the principal (1+0.036/12)12 times 8 gives me aproxtimately 1997arrow_forwardWhat are the answers for star powerarrow_forwardThe recciprocal rulearrow_forward
- This is an example only. What can be a simialr equation with differnet numbers using logs and can have a mistake in one of the steps and what will be the correct way to solve it. Thanksarrow_forwardCan we have an exponential equation using logarithm however i want to show that one mistake is involved in solving it. Showing the mistake and how to be fixed. Thanks.arrow_forwardIs it possible to show me how to come up with an exponential equation by showing all the steps work and including at least one mistake that me as a person can make. Like a calculation mistake and high light what the mistake is. Thanks so much.arrow_forward
- Consider the weighted voting system [16: 15, 8, 3, 1]Find the Banzhaf power distribution of this weighted voting system.List the power for each player as a fraction: P1: P2: P3: P4:arrow_forwardSolutions of inequalitie Google Classroom Mic Is (-3, 2) a solution of 7x+9y > -3? Choose 1 answer: A Yes B No Related content ▶6:06 Testing solutions to inequalities 2 of 4arrow_forwardAre natural logarithms used in real life ? How ? Can u give me two or three ways we can use them. Thanksarrow_forward
- ?arrow_forwardSolve the equation. Write the smaller answer first. 2 (x-6)² = 36 x = Α x = Previous Page Next Pagearrow_forwardWrite a quadratic equation in factored form that has solutions of x = 2 and x = = -3/5 ○ a) (x-2)(5x + 3) = 0 ○ b) (x + 2)(3x-5) = 0 O c) (x + 2)(5x -3) = 0 ○ d) (x-2)(3x + 5) = 0arrow_forward
 Big Ideas Math A Bridge To Success Algebra 1: Stu...AlgebraISBN:9781680331141Author:HOUGHTON MIFFLIN HARCOURTPublisher:Houghton Mifflin Harcourt
 Glencoe Algebra 1, Student Edition, 9780079039897...AlgebraISBN:9780079039897Author:CarterPublisher:McGraw Hill
 Holt Mcdougal Larson Pre-algebra: Student Edition...AlgebraISBN:9780547587776Author:HOLT MCDOUGALPublisher:HOLT MCDOUGAL
 Algebra: Structure And Method, Book 1AlgebraISBN:9780395977224Author:Richard G. Brown, Mary P. Dolciani, Robert H. Sorgenfrey, William L. ColePublisher:McDougal Littell


