
Concept explainers
Videos
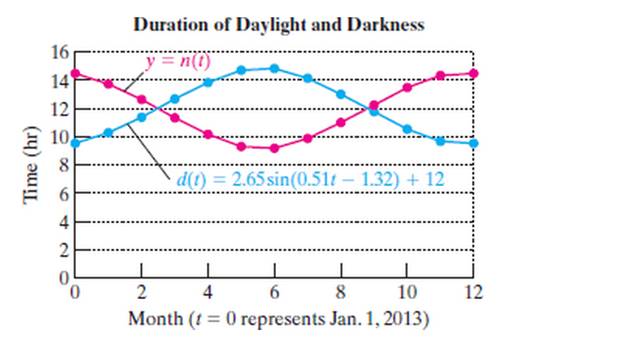
The duration of daylight and darkness varies during the year due to the angle of the Sun in the sky. The model
a. Describe the relationship between the graphs of the functions and the line
b. Use the result of part (a) and a transformation of
c. What do the points of intersection of the two graphs represent?
d. What do the relative
e. What does
Want to see the full answer?
Check out a sample textbook solution
Chapter 5 Solutions
COLLEGE ALG.+TRIG.-ALEKS ACCESS (6 WK.)


- 88 MULTIPLE CHOICE Question 7 Listen The following irrational expression is given in unsimplified form with four op- tions in simplified form. Select the correct simplified form. Select only one option. A 2±3√√2 B 4±√3 2±√ √3 D 1±√√3 DELL FLOWER CHILD 11/200 4 ± √48 4 ✓ All Changes Saved 165arrow_forwardUse the graph of y = f(x) to answer the following. 3- 2 -4 -2 -1 1 2 3 4 -1 2 m -3- + (d) Find all x for which f(x) = -2. If there is more than one value, separate them with commas or write your answer in interval notation, if necessary. Select "None", if applicable. Value(s) of x for which f(x)=-2: | (0,0) (0,0) (0,0) (0,0) 0,0... -00 None (h) Determine the range of f. The range is (0,0) Garrow_forwardWhat is g(f(4))arrow_forward
- 10) Multiply (8m + 3)² A) 8m²+11m+6 B) m² + 48m+9 C) 64m²+48m+9 D) 16m²+11m+6arrow_forwardLet R be field and X= R³/s Vector space over R M=(a,b,c)labic, e Rra+b= 3- <3 Show that Ms and why with proof. 1) is convexset and affine set of botost ii) is blanced set and symmetirs set of x iii) is hy per space and hyper plane ofx or hot iii) find f:MR st kerf = M 18/103 and finnd fiM→R/{0} st M= {xEX, f(t) = x, texiαER? jiii) show that Mis Maxsubspace or not and Mis a max. affine set or not.arrow_forwardFind The partial fraction decomposition for each The following 2× B) (x+3) a 3 6 X-3x+2x-6arrow_forward
- 1) Find the partial feraction decomposition for each of 5- X 2 2x+x-1 The following: 3 B) 3 X + 3xarrow_forwardT={(−7,1),(1,−1),(6,−8),(2,8)} Find the domain and range of the inverse. Express your answer as a set of numbers.arrow_forwardT={(−7,1),(1,−1),(6,−8),(2,8)}. Find the inverse. Express your answer as a set of ordered pairs.arrow_forward
- 2.8.1arrow_forwardKate, Luke, Mary and Nancy are sharing a cake. The cake had previously been divided into four slices (s1, s2, s3 and s4). The following table shows the values of the slices in the eyes of each player. What is fair share to nancy? S1 S2 S3 S4 Kate $4.00 $6.00 $6.00 $4.00 Luke $5.30 $5.00 $5.25 $5.45 Mary $4.25 $4.50 $3.50 $3.75 Nancy $6.00 $4.00 $4.00 $6.00arrow_forwardKate, Luke, Mary and Nancy are sharing a cake. The cake had previously been divided into four slices (s1, s2, s3 and s4). The following table shows the values of the slices in the eyes of each player. S1 S2 S3 S4 Kate $4.00 $6.00 $6.00 $4.00 Luke $5.30 $5.00 $5.25 $5.45 Mary $4.25 $4.50 $3.50 $3.75 Nancy $6.00 $4.00 $4.00 $6.00 how much is the cak worth to maryarrow_forward
 College Algebra (MindTap Course List)AlgebraISBN:9781305652231Author:R. David Gustafson, Jeff HughesPublisher:Cengage Learning
 Mathematics For Machine TechnologyAdvanced MathISBN:9781337798310Author:Peterson, John.Publisher:Cengage Learning,
 Algebra & Trigonometry with Analytic GeometryAlgebraISBN:9781133382119Author:SwokowskiPublisher:Cengage
 Holt Mcdougal Larson Pre-algebra: Student Edition...AlgebraISBN:9780547587776Author:HOLT MCDOUGALPublisher:HOLT MCDOUGAL
 Trigonometry (MindTap Course List)TrigonometryISBN:9781337278461Author:Ron LarsonPublisher:Cengage Learning
 Algebra and Trigonometry (MindTap Course List)AlgebraISBN:9781305071742Author:James Stewart, Lothar Redlin, Saleem WatsonPublisher:Cengage Learning