
Videos
The paper “How Lead Exposure Relates to Temporal Changes in IQ, Violent Crime, and Unwed Pregnancy” (Environmental Research [2000]: 1–22) investigated whether childhood lead exposure is related to criminal behavior in young adults. Using historical data, the author paired y = Assault rate (assaults per 100,000 people) for each year from 1964 to 1997 with a measure of lead exposure (tons of gasoline lead per 1000 people) 23 years earlier. For example, the lead exposure from 1974 was paired with the assault rate from 1997.
The author chose to go back 23 years for lead exposure because the highest number of assaults are committed by people in their early twenties, and 23 years earlier would represent a time when those in this age group were infants.
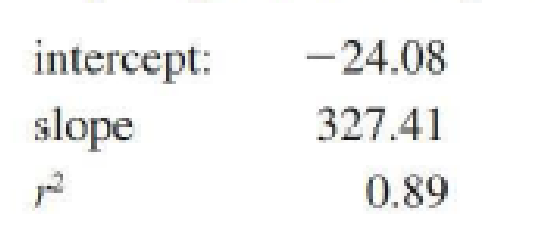
A least-squares line was used to describe the relationship between assault rate and lead exposure 23 years prior. Summary statistics given in the paper are
Use the information provided to answer the following questions.
- a. What is the value of the
correlation coefficient for x = Lead exposure 23 years prior and y = Assault rate? Interpret this value. Is it reasonable to conclude that increased lead exposure is the cause of increased assault rates? Explain. - b. What is the equation of the least-squares line? Use the line to predict assault rate in a year in which gasoline lead exposure 23 years prior was 0.5 tons per 1000 people.
- c. What proportion of year-to-year variability in assault rates can be explained by the relationship between assault rate and gasoline lead exposure 23 years earlier?
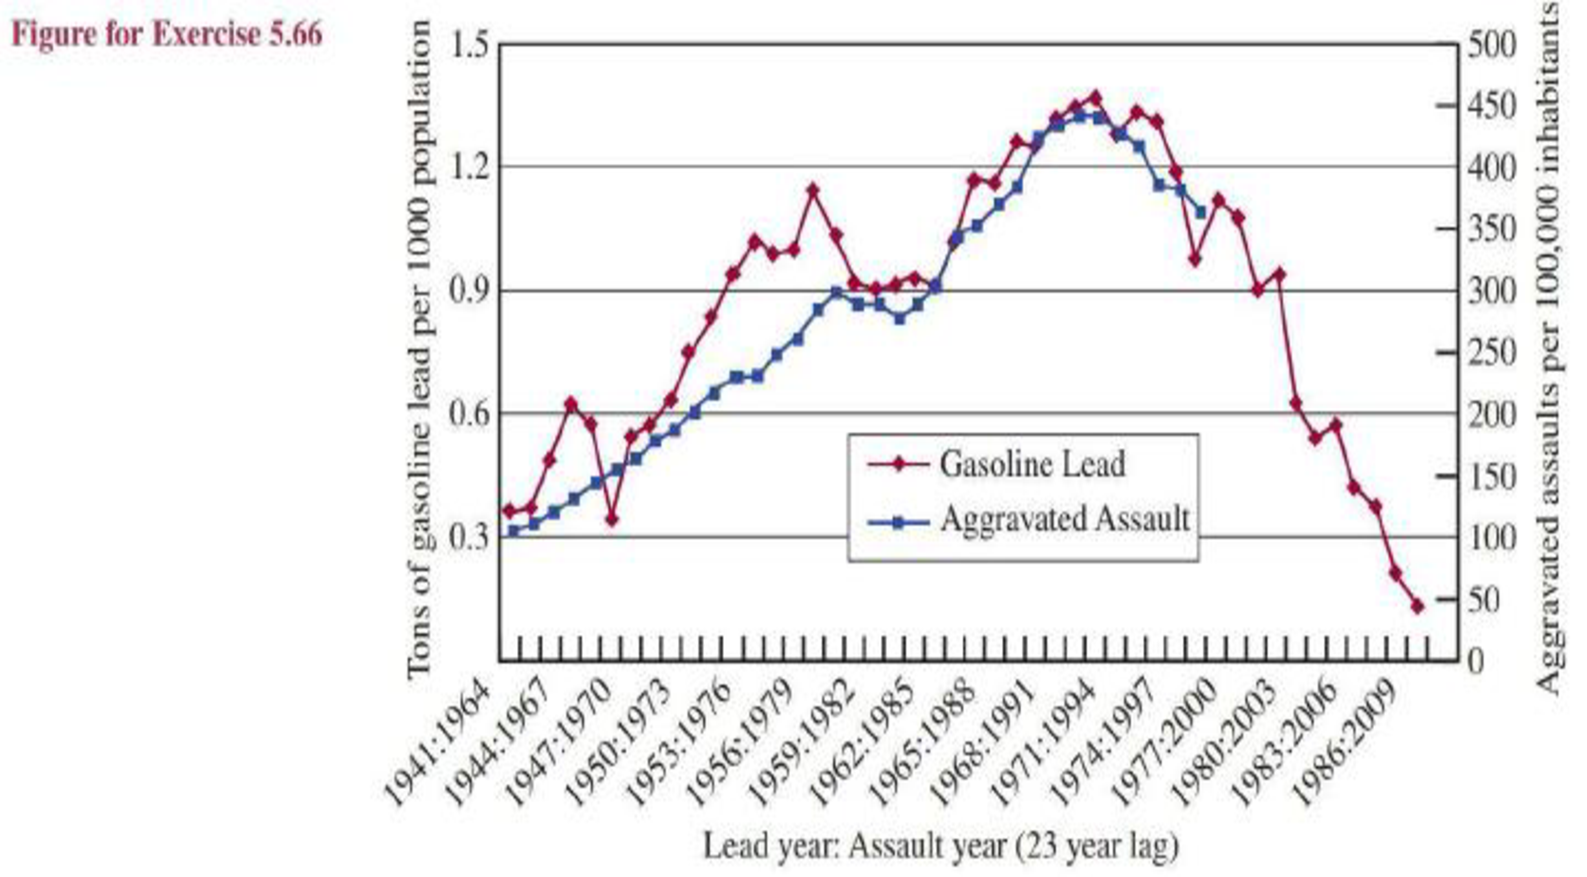
- d. The graph in the figure on the next page appeared in the paper. Note that this is not a
scatterplot of the (x, y) pairs—it is two separate time series plots. The time scale 1941, 1942, ..., 1986 is the time scale used for the lead exposure data and the time scale 1964, 1965, ..., 2009 is used for the assault rate data. Also note that at the time the graph was constructed, assault rate data was only available through 1997. Spend a few minutes thinking about the information contained in this graph and then briefly explain what aspect of this graph accounts for the reportedpositive correlation between assault rate and lead exposure 23 years prior.
Want to see the full answer?
Check out a sample textbook solution
Chapter 5 Solutions
Introduction to Statistics and Data Analysis


- 20 km, because GISS Worksheet 10 Jesse runs a small business selling and delivering mealie meal to the spaza shops. He charges a fixed rate of R80, 00 for delivery and then R15, 50 for each packet of mealle meal he delivers. The table below helps him to calculate what to charge his customers. 10 20 30 40 50 Packets of mealie meal (m) Total costs in Rands 80 235 390 545 700 855 (c) 10.1. Define the following terms: 10.1.1. Independent Variables 10.1.2. Dependent Variables 10.2. 10.3. 10.4. 10.5. Determine the independent and dependent variables. Are the variables in this scenario discrete or continuous values? Explain What shape do you expect the graph to be? Why? Draw a graph on the graph provided to represent the information in the table above. TOTAL COST OF PACKETS OF MEALIE MEAL 900 800 700 600 COST (R) 500 400 300 200 100 0 10 20 30 40 60 NUMBER OF PACKETS OF MEALIE MEALarrow_forwardLet X be a random variable with support SX = {−3, 0.5, 3, −2.5, 3.5}. Part ofits probability mass function (PMF) is given bypX(−3) = 0.15, pX(−2.5) = 0.3, pX(3) = 0.2, pX(3.5) = 0.15.(a) Find pX(0.5).(b) Find the cumulative distribution function (CDF), FX(x), of X.1(c) Sketch the graph of FX(x).arrow_forwardA well-known company predominantly makes flat pack furniture for students. Variability with the automated machinery means the wood components are cut with a standard deviation in length of 0.45 mm. After they are cut the components are measured. If their length is more than 1.2 mm from the required length, the components are rejected. a) Calculate the percentage of components that get rejected. b) In a manufacturing run of 1000 units, how many are expected to be rejected? c) The company wishes to install more accurate equipment in order to reduce the rejection rate by one-half, using the same ±1.2mm rejection criterion. Calculate the maximum acceptable standard deviation of the new process.arrow_forward
- 5. Let X and Y be independent random variables and let the superscripts denote symmetrization (recall Sect. 3.6). Show that (X + Y) X+ys.arrow_forward8. Suppose that the moments of the random variable X are constant, that is, suppose that EX" =c for all n ≥ 1, for some constant c. Find the distribution of X.arrow_forward9. The concentration function of a random variable X is defined as Qx(h) = sup P(x ≤ X ≤x+h), h>0. Show that, if X and Y are independent random variables, then Qx+y (h) min{Qx(h). Qr (h)).arrow_forward
- 10. Prove that, if (t)=1+0(12) as asf->> O is a characteristic function, then p = 1.arrow_forward9. The concentration function of a random variable X is defined as Qx(h) sup P(x ≤x≤x+h), h>0. (b) Is it true that Qx(ah) =aQx (h)?arrow_forward3. Let X1, X2,..., X, be independent, Exp(1)-distributed random variables, and set V₁₁ = max Xk and W₁ = X₁+x+x+ Isk≤narrow_forward
- 7. Consider the function (t)=(1+|t|)e, ER. (a) Prove that is a characteristic function. (b) Prove that the corresponding distribution is absolutely continuous. (c) Prove, departing from itself, that the distribution has finite mean and variance. (d) Prove, without computation, that the mean equals 0. (e) Compute the density.arrow_forward1. Show, by using characteristic, or moment generating functions, that if fx(x) = ½ex, -∞0 < x < ∞, then XY₁ - Y2, where Y₁ and Y2 are independent, exponentially distributed random variables.arrow_forward1. Show, by using characteristic, or moment generating functions, that if 1 fx(x): x) = ½exarrow_forward
 Big Ideas Math A Bridge To Success Algebra 1: Stu...AlgebraISBN:9781680331141Author:HOUGHTON MIFFLIN HARCOURTPublisher:Houghton Mifflin Harcourt
 Glencoe Algebra 1, Student Edition, 9780079039897...AlgebraISBN:9780079039897Author:CarterPublisher:McGraw Hill
 Functions and Change: A Modeling Approach to Coll...AlgebraISBN:9781337111348Author:Bruce Crauder, Benny Evans, Alan NoellPublisher:Cengage Learning
 Holt Mcdougal Larson Pre-algebra: Student Edition...AlgebraISBN:9780547587776Author:HOLT MCDOUGALPublisher:HOLT MCDOUGAL