
Concept explainers
Videos
To analyze:
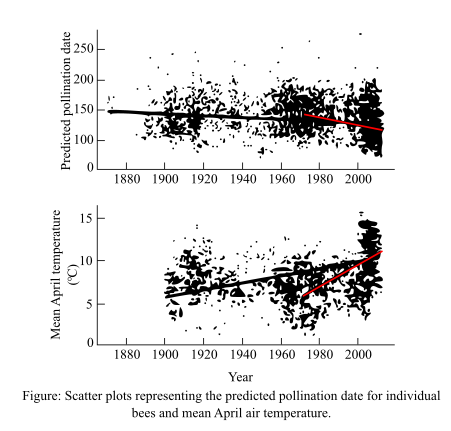
The trends observed from the given graph; the trend that has been observed over time in the bee pollination date and in mean April temperature; the reason due to which the two trends moved in opposite directions and the significance of the difference in slope of the entire time period
versus the shorter time period, after 1970.
Given:
The scatter plots of the distribution, for the dates that are predicted for pollination by individual bee species, has been plotted in the top graph (between the years 1870–2010) and for the mean April air temperature (1900–2010) has been plotted in the bottom graph.
Introduction:
The scientists took 10 bee species and observed their pollination trends across North America. The trends between the pollination time by individual bee species and the flowering of plants during spring season was observed. These trends were also correlated with the mean air temperature of April (spring season occurs in North America during the April month). All these trends were observed for about 13 years.
Want to see the full answer?
Check out a sample textbook solution
Chapter 55 Solutions
Life: The Science of Biology


- Describe the principle of homeostasis.arrow_forwardExplain how the hormones of the glands listed below travel around the body to target organs and tissues : Pituitary gland Hypothalamus Thyroid Parathyroid Adrenal Pineal Pancreas(islets of langerhans) Gonads (testes and ovaries) Placentaarrow_forwardWhat are the functions of the hormones produced in the glands listed below: Pituitary gland Hypothalamus Thyroid Parathyroid Adrenal Pineal Pancreas(islets of langerhans) Gonads (testes and ovaries) Placentaarrow_forward
- Describe the hormones produced in the glands listed below: Pituitary gland Hypothalamus Thyroid Parathyroid Adrenal Pineal Pancreas(islets of langerhans) Gonads (testes and ovaries) Placentaarrow_forwardPlease help me calculate drug dosage from the following information: Patient weight: 35 pounds, so 15.9 kilograms (got this by dividing 35 pounds by 2.2 kilograms) Drug dose: 0.05mg/kg Drug concentration: 2mg/mLarrow_forwardA 25-year-old woman presents to the emergency department with a 2-day history of fever, chills, severe headache, and confusion. She recently returned from a trip to sub-Saharan Africa, where she did not take malaria prophylaxis. On examination, she is febrile (39.8°C/103.6°F) and hypotensive. Laboratory studies reveal hemoglobin of 8.0 g/dL, platelet count of 50,000/μL, and evidence of hemoglobinuria. A peripheral blood smear shows ring forms and banana-shaped gametocytes. Which of the following Plasmodium species is most likely responsible for her severe symptoms? A. Plasmodium vivax B. Plasmodium ovale C. Plasmodium malariae D. Plasmodium falciparumarrow_forward
- please fill in missing parts , thank youarrow_forwardplease draw in the answers, thank youarrow_forwarda. On this first grid, assume that the DNA and RNA templates are read left to right. DNA DNA mRNA codon tRNA anticodon polypeptide _strand strand C с A T G A U G C A TRP b. Now do this AGAIN assuming that the DNA and RNA templates are read right to left. DNA DNA strand strand C mRNA codon tRNA anticodon polypeptide 0 A T G A U G с A TRParrow_forward
 Case Studies In Health Information ManagementBiologyISBN:9781337676908Author:SCHNERINGPublisher:Cengage
 Biology (MindTap Course List)BiologyISBN:9781337392938Author:Eldra Solomon, Charles Martin, Diana W. Martin, Linda R. BergPublisher:Cengage Learning
 Biology: The Dynamic Science (MindTap Course List)BiologyISBN:9781305389892Author:Peter J. Russell, Paul E. Hertz, Beverly McMillanPublisher:Cengage Learning
 Concepts of BiologyBiologyISBN:9781938168116Author:Samantha Fowler, Rebecca Roush, James WisePublisher:OpenStax College
 Biology 2eBiologyISBN:9781947172517Author:Matthew Douglas, Jung Choi, Mary Ann ClarkPublisher:OpenStax