
Videos
Temperature An object at a temperature of
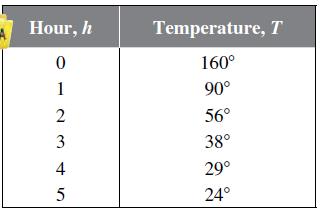
(a)The figure below shows the graph of the model. Use the graph to identify the horizontal asymptote of the model and interpret the asymptote in the context of the problem.
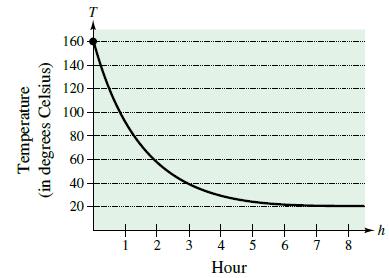
(b) Use the model to approximate the time it took for the object to reach a temperature of

Trending nowThis is a popular solution!

Chapter 5 Solutions
EBK COLLEGE ALGEBRA


- If $8000 is deposited into an account earning simple interest at an annual interest rate of 4% for 10 years, howmuch interest was earned? Show you work.arrow_forward10-2 Let A = 02-4 and b = 4 Denote the columns of A by a₁, a2, a3, and let W = Span {a1, a2, a̸3}. -4 6 5 - 35 a. Is b in {a1, a2, a3}? How many vectors are in {a₁, a₂, a3}? b. Is b in W? How many vectors are in W? c. Show that a2 is in W. [Hint: Row operations are unnecessary.] a. Is b in {a₁, a2, a3}? Select the correct choice below and, if necessary, fill in the answer box(es) to complete your choice. ○ A. No, b is not in {a₁, a2, 3} since it cannot be generated by a linear combination of a₁, a2, and a3. B. No, b is not in (a1, a2, a3} since b is not equal to a₁, a2, or a3. C. Yes, b is in (a1, a2, a3} since b = a (Type a whole number.) D. Yes, b is in (a1, a2, 3} since, although b is not equal to a₁, a2, or a3, it can be expressed as a linear combination of them. In particular, b = + + ☐ az. (Simplify your answers.)arrow_forward14 14 4. The graph shows the printing rate of Printer A. Printer B can print at a rate of 25 pages per minute. How does the printing rate for Printer B compare to the printing rate for Printer A? The printing rate for Printer B is than the rate for Printer A because the rate of 25 pages per minute is than the rate of for Printer A. pages per minute RIJOUT 40 fy Printer Rat Number of Pages 8N WA 10 30 20 Printer A 0 0 246 Time (min) Xarrow_forward
- OR 16 f(x) = Ef 16 χ по x²-2 410 | y = (x+2) + 4 Y-INT: y = 0 X-INT: X=0 VA: x=2 OA: y=x+2 0 X-INT: X=-2 X-INT: y = 2 VA 0 2 whole. 2-2 4 y - (x+2) = 27-270 + xxx> 2 क् above OA (x+2) OA x-2/x²+0x+0 2 x-2x 2x+O 2x-4 4 X<-1000 4/4/2<0 below Of y VA X=2 X-2 OA y=x+2 -2 2 (0,0) 2 χarrow_forwardI need help solving the equation 3x+5=8arrow_forwardWhat is the domain, range, increasing intervals (theres 3), decreasing intervals, roots, y-intercepts, end behavior (approaches four times), leading coffiencent status (is it negative, positivie?) the degress status (zero, undifined etc ), the absolute max, is there a absolute minimum, relative minimum, relative maximum, the root is that has a multiplicity of 2, the multiplicity of 3.arrow_forward
- What is the vertex, axis of symmerty, all of the solutions, all of the end behaviors, the increasing interval, the decreasing interval, describe all of the transformations that have occurred EXAMPLE Vertical shrink/compression (wider). or Vertical translation down, the domain and range of this graph EXAMPLE Domain: x ≤ -1 Range: y ≥ -4.arrow_forward4. Select all of the solutions for x²+x - 12 = 0? A. -12 B. -4 C. -3 D. 3 E 4 F 12 4 of 10arrow_forward2. Select all of the polynomials with the degree of 7. A. h(x) = (4x + 2)³(x − 7)(3x + 1)4 B h(x) = (x + 7)³(2x + 1)^(6x − 5)² ☐ Ch(x)=(3x² + 9)(x + 4)(8x + 2)ª h(x) = (x + 6)²(9x + 2) (x − 3) h(x)=(-x-7)² (x + 8)²(7x + 4)³ Scroll down to see more 2 of 10arrow_forward
- 1. If all of the zeros for a polynomial are included in the graph, which polynomial could the graph represent? 100 -6 -2 0 2 100 200arrow_forward3. Select the polynomial that matches the description given: Zero at 4 with multiplicity 3 Zero at −1 with multiplicity 2 Zero at -10 with multiplicity 1 Zero at 5 with multiplicity 5 ○ A. P(x) = (x − 4)³(x + 1)²(x + 10)(x — 5)³ B - P(x) = (x + 4)³(x − 1)²(x − 10)(x + 5)³ ○ ° P(x) = (1 − 3)'(x + 2)(x + 1)"'" (x — 5)³ 51 P(r) = (x-4)³(x − 1)(x + 10)(x − 5 3 of 10arrow_forwardMatch the equation, graph, and description of transformation. Horizontal translation 1 unit right; vertical translation 1 unit up; vertical shrink of 1/2; reflection across the x axis Horizontal translation 1 unit left; vertical translation 1 unit down; vertical stretch of 2 Horizontal translation 2 units right; reflection across the x-axis Vertical translation 1 unit up; vertical stretch of 2; reflection across the x-axis Reflection across the x - axis; vertical translation 2 units down Horizontal translation 2 units left Horizontal translation 2 units right Vertical translation 1 unit down; vertical shrink of 1/2; reflection across the x-axis Vertical translation 2 units down Horizontal translation 1 unit left; vertical translation 2 units up; vertical stretch of 2; reflection across the x - axis f(x) = - =-½ ½ (x − 1)²+1 f(x) = x²-2 f(x) = -2(x+1)²+2 f(x)=2(x+1)²-1 f(x)=-(x-2)² f(x)=(x-2)² f(x) = f(x) = -2x²+1 f(x) = -x²-2 f(x) = (x+2)²arrow_forward
 Algebra & Trigonometry with Analytic GeometryAlgebraISBN:9781133382119Author:SwokowskiPublisher:Cengage
 College AlgebraAlgebraISBN:9781305115545Author:James Stewart, Lothar Redlin, Saleem WatsonPublisher:Cengage Learning