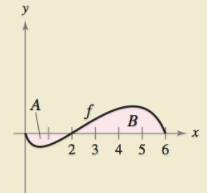
HOW DO YOU SEE IT? The graph of f is shown in the figure. The shaded region A has an area of 1.5, and
(a).
(b).
(c).
(d).
(e).
(f). The average value of f over the interval [0, 6] is

Want to see the full answer?
Check out a sample textbook solution
Chapter 5 Solutions
Calculus: Early Transcendental Functions (MindTap Course List)
- Draw the asymptotes (if there are any). Then plot two points on each piece of the graph.arrow_forwardCancel Done RESET Suppose that R(x) is a polynomial of degree 7 whose coefficients are real numbers. Also, suppose that R(x) has the following zeros. -1-4i, -3i, 5+i Answer the following. (a) Find another zero of R(x). ☐ | | | | |│ | | | -1 བ ¢ Live Adjust Filters Croparrow_forwardSuppose that R (x) is a polynomial of degree 7 whose coefficients are real numbers. Also, suppose that R (x) has the following zeros. -1-4i, -3i, 5+i Answer the following. (c) What is the maximum number of nonreal zeros that R (x) can have? ☐arrow_forward
- Suppose that R (x) is a polynomial of degree 7 whose coefficients are real numbers. Also, suppose that R (x) has the following zeros. -1-4i, -3i, 5+i Answer the following. (b) What is the maximum number of real zeros that R (x) can have? ☐arrow_forwardi need help please dont use chat gptarrow_forward3.1 Limits 1. If lim f(x)=-6 and lim f(x)=5, then lim f(x). Explain your choice. x+3° x+3* x+3 (a) Is 5 (c) Does not exist (b) is 6 (d) is infinitearrow_forward
- 1 pts Let F and G be vector fields such that ▼ × F(0, 0, 0) = (0.76, -9.78, 3.29), G(0, 0, 0) = (−3.99, 6.15, 2.94), and G is irrotational. Then sin(5V (F × G)) at (0, 0, 0) is Question 1 -0.246 0.072 -0.934 0.478 -0.914 -0.855 0.710 0.262 .arrow_forward2. Answer the following questions. (A) [50%] Given the vector field F(x, y, z) = (x²y, e", yz²), verify the differential identity Vx (VF) V(V •F) - V²F (B) [50%] Remark. You are confined to use the differential identities. Let u and v be scalar fields, and F be a vector field given by F = (Vu) x (Vv) (i) Show that F is solenoidal (or incompressible). (ii) Show that G = (uvv – vVu) is a vector potential for F.arrow_forwardA driver is traveling along a straight road when a buffalo runs into the street. This driver has a reaction time of 0.75 seconds. When the driver sees the buffalo he is traveling at 44 ft/s, his car can decelerate at 2 ft/s^2 when the brakes are applied. What is the stopping distance between when the driver first saw the buffalo, to when the car stops.arrow_forward
- Topic 2 Evaluate S x dx, using u-substitution. Then find the integral using 1-x2 trigonometric substitution. Discuss the results! Topic 3 Explain what an elementary anti-derivative is. Then consider the following ex integrals: fed dx x 1 Sdx In x Joseph Liouville proved that the first integral does not have an elementary anti- derivative Use this fact to prove that the second integral does not have an elementary anti-derivative. (hint: use an appropriate u-substitution!)arrow_forward1. Given the vector field F(x, y, z) = -xi, verify the relation 1 V.F(0,0,0) = lim 0+ volume inside Se ff F• Nds SE where SE is the surface enclosing a cube centred at the origin and having edges of length 2€. Then, determine if the origin is sink or source.arrow_forward4 3 2 -5 4-3 -2 -1 1 2 3 4 5 12 23 -4 The function graphed above is: Increasing on the interval(s) Decreasing on the interval(s)arrow_forward
- Algebra & Trigonometry with Analytic GeometryAlgebraISBN:9781133382119Author:SwokowskiPublisher:Cengage

 College Algebra (MindTap Course List)AlgebraISBN:9781305652231Author:R. David Gustafson, Jeff HughesPublisher:Cengage Learning
  Algebra: Structure And Method, Book 1AlgebraISBN:9780395977224Author:Richard G. Brown, Mary P. Dolciani, Robert H. Sorgenfrey, William L. ColePublisher:McDougal Littell
 Algebra and Trigonometry (MindTap Course List)AlgebraISBN:9781305071742Author:James Stewart, Lothar Redlin, Saleem WatsonPublisher:Cengage Learning


