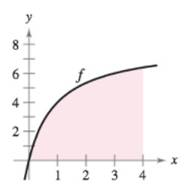
Graphical Reasoning Consider the region bounded by the graphs of
(a) Redraw the figure, and complete and shade the rectangles representing the lower sum when
(b) Redraw the figure, and complete and shade the rectangles representing the upper sum when
(c) Redraw the figure, and complete and shade the rectangles whose heights arc determined by the function values at the midpoint of each subinterval when
(d) Verify the following formulas for approximating the area of the region using n subintervals of equal width

Lower sum:
Upper sum:
Midpoinr rule:
(e) Use a graphing utility to create a table of value of s(n), S(n) and M(n) for
(f) Explain why s(n) increase and S(n) decrease for increase value of n as shown in the table in part (e).
Trending nowThis is a popular solution!

Chapter 5 Solutions
Calculus: Early Transcendental Functions (MindTap Course List)
- Find the (exact) direction cosines and (rounded to 1 decimal place) direction angles of = (3,7,6)arrow_forwardLet a = (-1, -2, -3) and 6 = (-4, 0, 1). Find the component of b onto a.arrow_forwardForces of 9 pounds and 15 pounds act on each other with an angle of 72°. The magnitude of the resultant force The resultant force has an angle of pounds. * with the 9 pound force. The resultant force has an angle of with the 15 pound force. It is best to calculate each angle separately and check by seeing if they add to 72°.arrow_forward
- = Let (6,2,-5) and = (5,4, -6). Compute the following: บี.บี. บี. นี = 2 −4(u. v) = (-4). v= ū. (-40) (ū. v) v =arrow_forwardLet ā-6+4j- 1k and b = 7i8j+3k. Find a. b.arrow_forwardFind the volume of the parallelepiped determined by the vectors a = (3, 5, −1), ☎ = (0, 3, 1), c = (2,4,1).arrow_forward
- Find the area of a triangle PQR, where P = (-5,6, -1), Q = (1, -3, -2), and R = (-5, -1,4)arrow_forward17. [-/1 Points] DETAILS MY NOTES SESSCALCET2 6.2.050. Evaluate the integral. (Remember to use absolute values where appropriate. Use C for the constant of integration.) du 4√3- -4² Need Help? Read It SUBMIT ANSWER 18. [-/1 Points] DETAILS MY NOTES SESSCALCET2 6.2.051. Evaluate the integral. (Use C for the constant of integration.) - 49 dx x² +3 Need Help? Read It Watch It SUBMIT ANSWER 19. [-/1 Points] DETAILS MY NOTES SESSCALCET2 6.2.057. Evaluate the integral. (Remember to use absolute values where appropriate. Use C for the constant of integration.) 25+ x2 dxarrow_forwardLet (5,3,-7) and = (2, -3, -6). = Compute the following: u× u = -4(u xv) ux (-4v) (+v) × v=arrow_forward
- Let a = (4, -2, -7) and 6 = (2,5, 3). (ã − ò) × (ã + b) =arrow_forwardUse the graph of the function y = f (x) to find the value, if possible. f(x) 8 7 6 Q5 y 3 2 1 x -8 -7 -6 -5 -4 -3 -2 -1 1 2 3 4 5 6 7 8 -1 -2 -3 -4 -5 -6 -7 -8+ Olim f(z) x-1+ O Limit does not exist.arrow_forwardIf h(x) = -2x-8 49x2-9 what is lim h(x)? x--00arrow_forward
- Algebra & Trigonometry with Analytic GeometryAlgebraISBN:9781133382119Author:SwokowskiPublisher:Cengage
 Elementary AlgebraAlgebraISBN:9780998625713Author:Lynn Marecek, MaryAnne Anthony-SmithPublisher:OpenStax - Rice University

