
a)
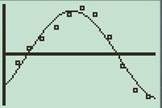
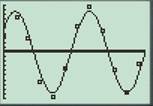
To plot: The scatterplot of the given data of day of the year and time as the number of minutes past 18:30.
The scatterplot of the given data is shown below.
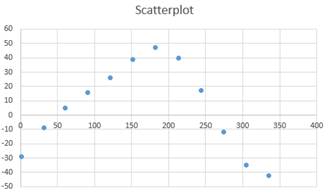
Given:The data of the year and time as the number of minutes past 18:30 is shown below
| Day | 18:30+ |
| 1 | -29 |
| 32 | -9 |
| 60 | 5 |
| 91 | 16 |
| 121 | 26 |
| 152 | 39 |
| 182 | 47 |
| 213 | 40 |
| 244 | 17 |
| 274 | -12 |
| 305 | -35 |
| 335 | -42 |
Plot:The data of the day of the year in L1 and the number of minutes past 18:30 in L2 and using this data a scatterplot is plotted as shown below
b)
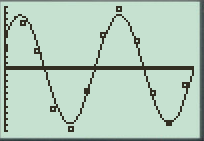
To plot: Superimpose the graph on the scatterplot and verify if it is a good fit.
The superimposing of the graph on scatterplot is shown below
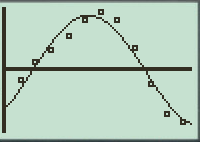
The model looks like a good fit.
Plot:
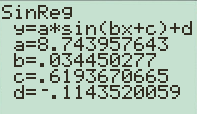
Press “STAT” in the calculator and then go to “CALC” menu and choose SinReg function and click enter. Select the data entered in L1 and L2 to plot the curve and click ok to get the following output and graph
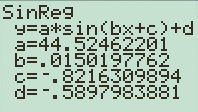
Interpretation:With reference to Sin regression output the regression equation is
c)
To calculate: The predicted y value and also the residual values for the given data.
The predicted values and residuals for the given data are shown below
| L1 (Day) | L2 (18:30+) | L3 | L4 |
| 1 | -29 | -32.68 | 3.68 |
| 32 | -9 | -15.44 | 6.44 |
| 60 | 5 | 2.97 | 2.03 |
| 91 | 16 | 22.49 | -6.49 |
| 121 | 26 | 36.76 | -10.76 |
| 152 | 39 | 43.66 | -4.66 |
| 182 | 47 | 41.40 | 5.60 |
| 213 | 40 | 30.30 | 9.70 |
| 244 | 17 | 12.64 | 4.36 |
| 274 | -12 | -7.17 | -4.83 |
| 305 | -35 | -26.22 | -8.78 |
| 335 | -42 | -39.50 | -2.50 |
Plot:
With reference to the data given in L1 and L2, column L3 shows the predicted values and column L4 shows residuals.
The predicted value in L3 is calculated by plugging in the values of x, and y in the regression equation as shown below
Similarly, for all values column L3 is created in the calculator and in column L4 the residuals are calculated using
| L1 (Day) | L2 (18:30+) | L3 | L4 |
| 1 | -29 | -32.68 | 3.68 |
| 32 | -9 | -15.44 | 6.44 |
| 60 | 5 | 2.97 | 2.03 |
| 91 | 16 | 22.49 | -6.49 |
| 121 | 26 | 36.76 | -10.76 |
| 152 | 39 | 43.66 | -4.66 |
| 182 | 47 | 41.40 | 5.60 |
| 213 | 40 | 30.30 | 9.70 |
| 244 | 17 | 12.64 | 4.36 |
| 274 | -12 | -7.17 | -4.83 |
| 305 | -35 | -26.22 | -8.78 |
| 335 | -42 | -39.50 | -2.50 |
d)
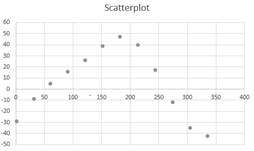
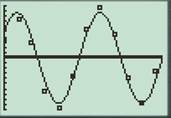
To plot: The scatterplot of the given data of day of the year in L1 and the residuals in L3.
The scatterplot of the data in L1 and the residuals is shown below
The sine regression equation is
Plot:The data of the day of the year in L1 and the residuals in L3 are used to generate the regression output by clicking on STAT and then to CALC menu. In the options mentioned SinReg option is selected and the appropriate data is entered and a scatterplot is plotted as shown below
e)
To Interpret: The two scatterplots obtained for the data in L1, L2 and L1, L3.
The two scatterplots of the data in L1, L2 and L1, L3 are shown below

Both regressions indicate that the behaviour of the sunset as a function of time is sinusoidal.
Interpretation:
With reference to previous parts the scatter plots of the data L1, L2, and L1, L3 both have a sinusoidal graph. Thus there exists a periodic behavior of sunset with respect to time.
Chapter 5 Solutions
PRECALCULUS:...COMMON CORE ED.-W/ACCESS

- Consider the sequence below: 1 1 1 (a) Express this sequence as a recurrence relation (b) Express this sequence in the form {a}=1 (c) Does this sequence converge or diverge? Justify your answer. Consider the sequence below: 1 1 1 1, 4' 9' 16' (a) Express this sequence in the form {ak}=1 (b) Does this sequence converge or diverge? Justify your answer. Consider the sequence below: 345 2. 4' 9' 16' ·} (a) Express this sequence in the form {a}1 (b) Does this sequence converge or diverge? Justify your answer.arrow_forwardUse the growth rate of sequences theorem to find the limit or state it divergesarrow_forwardcalculate the maximum value of the directional derivativearrow_forward
- 2. A tank with a capacity of 650 gal. originally contains 200 gal of water with 100 lb. of salt in solution. Water containing 1 lb. of salt per gallon is entering at a rate of 4 gal/min, and the mixture is allowed to flow out of the tank at a rate of 3 gal/min. a. Find the amount of salt in the tank at any time prior to the instant when the tank begins to overflow (650 gallons). b. Find the concentration (in pounds per gallon) of salt in the tank when the tank hits 400 gallons. D.E. for mixture problems: dv dt=11-12 dA A(t) dtarrow_forward- Suppose that you have the differential equation: dy = (y - 2) (y+3) dx a. What are the equilibrium solutions for the differential equation? b. Where is the differential equation increasing or decreasing? Show how you know. Showing them on the drawing is not enough. c. Where are the changes in concavity for the differential equation? Show how you know. Showing them on the drawing is not enough. d. Consider the slope field for the differential equation. Draw solution curves given the following initial conditions: i. y(0) = -5 ii. y(0) = -1 iii. y(0) = 2arrow_forward5. Suppose that a mass of 5 stretches a spring 10. The mass is acted on by an external force of F(t)=10 sin () and moves in a medium that gives a damping coefficient of ½. If the mass is set in motion with an initial velocity of 3 and is stretched initially to a length of 5. (I purposefully removed the units- don't worry about them. Assume no conversions are needed.) a) Find the equation for the displacement of the spring mass at time t. b) Write the equation for the displacement of the spring mass in phase-mode form. c) Characterize the damping of the spring mass system as overdamped, underdamped or critically damped. Explain how you know. D.E. for Spring Mass Systems k m* g = kLo y" +—y' + — —±y = —±F(t), y(0) = yo, y'(0) = vo m 2 A₁ = √c₁² + C₂² Q = tan-1arrow_forward
- 4. Given the following information determine the appropriate trial solution to find yp. Do not solve the differential equation. Do not find the constants. a) (D-4)2(D+ 2)y = 4e-2x b) (D+ 1)(D² + 10D +34)y = 2e-5x cos 3xarrow_forward3. Determine the appropriate annihilator for the given F(x). a) F(x) = 5 cos 2x b) F(x)=9x2e3xarrow_forwardTangent planes Find an equation of the plane tangent to the following surfaces at the given points (two planes and two equations).arrow_forward
- Vectors u and v are shown on the graph.Part A: Write u and v in component form. Show your work. Part B: Find u + v. Show your work.Part C: Find 5u − 2v. Show your work.arrow_forwardVectors u = 6(cos 60°i + sin60°j), v = 4(cos 315°i + sin315°j), and w = −12(cos 330°i + sin330°j) are given. Use exact values when evaluating sine and cosine.Part A: Convert the vectors to component form and find −7(u • v). Show every step of your work.Part B: Convert the vectors to component form and use the dot product to determine if u and w are parallel, orthogonal, or neither. Justify your answer.arrow_forwardSuppose that one factory inputs its goods from two different plants, A and B, with different costs, 3 and 7 each respective. And suppose the price function in the market is decided as p(x, y) = 100 - x - y where x and y are the demand functions and 0 < x, y. Then as x = y= the factory can attain the maximum profit,arrow_forward
 Calculus: Early TranscendentalsCalculusISBN:9781285741550Author:James StewartPublisher:Cengage Learning
 Thomas' Calculus (14th Edition)CalculusISBN:9780134438986Author:Joel R. Hass, Christopher E. Heil, Maurice D. WeirPublisher:PEARSON
 Calculus: Early Transcendentals (3rd Edition)CalculusISBN:9780134763644Author:William L. Briggs, Lyle Cochran, Bernard Gillett, Eric SchulzPublisher:PEARSON
 Calculus: Early TranscendentalsCalculusISBN:9781319050740Author:Jon Rogawski, Colin Adams, Robert FranzosaPublisher:W. H. Freeman
 Calculus: Early Transcendental FunctionsCalculusISBN:9781337552516Author:Ron Larson, Bruce H. EdwardsPublisher:Cengage Learning