
a)
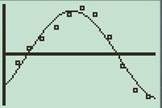
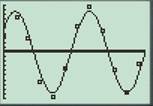
To plot: The scatterplot of the given data of day of the year and time as the number of minutes past 18:30.
The scatterplot of the given data is shown below.
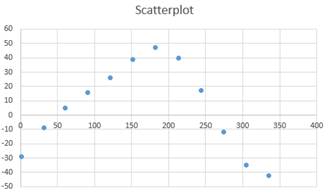
Given:The data of the year and time as the number of minutes past 18:30 is shown below
| Day | 18:30+ |
| 1 | -29 |
| 32 | -9 |
| 60 | 5 |
| 91 | 16 |
| 121 | 26 |
| 152 | 39 |
| 182 | 47 |
| 213 | 40 |
| 244 | 17 |
| 274 | -12 |
| 305 | -35 |
| 335 | -42 |
Plot:The data of the day of the year in L1 and the number of minutes past 18:30 in L2 and using this data a scatterplot is plotted as shown below
b)
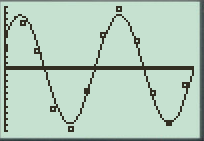
To plot: Superimpose the graph on the scatterplot and verify if it is a good fit.
The superimposing of the graph on scatterplot is shown below
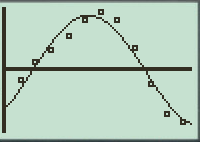
The model looks like a good fit.
Plot:
Press “STAT” in the calculator and then go to “CALC” menu and choose SinReg function and click enter. Select the data entered in L1 and L2 to plot the curve and click ok to get the following output and graph
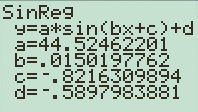
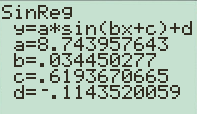
Interpretation:With reference to Sin regression output the regression equation is
c)
To calculate: The predicted y value and also the residual values for the given data.
The predicted values and residuals for the given data are shown below
| L1 (Day) | L2 (18:30+) | L3 | L4 |
| 1 | -29 | -32.68 | 3.68 |
| 32 | -9 | -15.44 | 6.44 |
| 60 | 5 | 2.97 | 2.03 |
| 91 | 16 | 22.49 | -6.49 |
| 121 | 26 | 36.76 | -10.76 |
| 152 | 39 | 43.66 | -4.66 |
| 182 | 47 | 41.40 | 5.60 |
| 213 | 40 | 30.30 | 9.70 |
| 244 | 17 | 12.64 | 4.36 |
| 274 | -12 | -7.17 | -4.83 |
| 305 | -35 | -26.22 | -8.78 |
| 335 | -42 | -39.50 | -2.50 |
Plot:
With reference to the data given in L1 and L2, column L3 shows the predicted values and column L4 shows residuals.
The predicted value in L3 is calculated by plugging in the values of x, and y in the regression equation as shown below
Similarly, for all values column L3 is created in the calculator and in column L4 the residuals are calculated using
| L1 (Day) | L2 (18:30+) | L3 | L4 |
| 1 | -29 | -32.68 | 3.68 |
| 32 | -9 | -15.44 | 6.44 |
| 60 | 5 | 2.97 | 2.03 |
| 91 | 16 | 22.49 | -6.49 |
| 121 | 26 | 36.76 | -10.76 |
| 152 | 39 | 43.66 | -4.66 |
| 182 | 47 | 41.40 | 5.60 |
| 213 | 40 | 30.30 | 9.70 |
| 244 | 17 | 12.64 | 4.36 |
| 274 | -12 | -7.17 | -4.83 |
| 305 | -35 | -26.22 | -8.78 |
| 335 | -42 | -39.50 | -2.50 |
d)
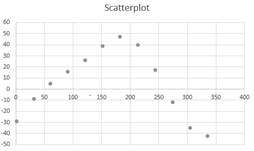
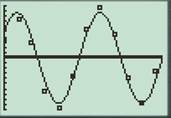
To plot: The scatterplot of the given data of day of the year in L1 and the residuals in L3.
The scatterplot of the data in L1 and the residuals is shown below
The sine regression equation is
Plot:The data of the day of the year in L1 and the residuals in L3 are used to generate the regression output by clicking on STAT and then to CALC menu. In the options mentioned SinReg option is selected and the appropriate data is entered and a scatterplot is plotted as shown below
e)
To Interpret: The two scatterplots obtained for the data in L1, L2 and L1, L3.
The two scatterplots of the data in L1, L2 and L1, L3 are shown below

Both regressions indicate that the behaviour of the sunset as a function of time is sinusoidal.
Interpretation:
With reference to previous parts the scatter plots of the data L1, L2, and L1, L3 both have a sinusoidal graph. Thus there exists a periodic behavior of sunset with respect to time.
Chapter 5 Solutions
PRECALCULUS:GRAPHICAL,...-NASTA ED.

 Calculus: Early TranscendentalsCalculusISBN:9781285741550Author:James StewartPublisher:Cengage Learning
 Thomas' Calculus (14th Edition)CalculusISBN:9780134438986Author:Joel R. Hass, Christopher E. Heil, Maurice D. WeirPublisher:PEARSON
 Calculus: Early Transcendentals (3rd Edition)CalculusISBN:9780134763644Author:William L. Briggs, Lyle Cochran, Bernard Gillett, Eric SchulzPublisher:PEARSON
 Calculus: Early TranscendentalsCalculusISBN:9781319050740Author:Jon Rogawski, Colin Adams, Robert FranzosaPublisher:W. H. Freeman
 Calculus: Early Transcendental FunctionsCalculusISBN:9781337552516Author:Ron Larson, Bruce H. EdwardsPublisher:Cengage Learning