
Concept explainers
Videos
Let’s eat: A fast-food restaurant chain has 600 outlets in the United States. The following table categorizes them by city population size and location; and presents the number of restaurants in each category. A restaurant is to be chosen at random from the 600 to test market a new menu.
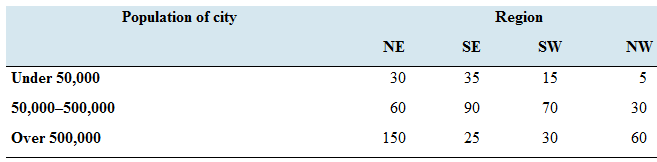
Given that the restaurant is located in a city with a population over 500,000, what is die
Given that the restaurant is located in the Southeast, what is the probability that it is in a city with a population under 50,000?
Given that the restaurant is located in the Southwest what is the probability that it is in a city with a population of 500,000 or less?
Given that the restaurant is located in a city with a population of 500,000 or less, what is the probability that it is in the Southwest?
Given that the restaurant is located in the South (either SE or SW), what is the probability that it is in a city with a population of 50,000 or more?
(a)
The probability that the restaurant is in Northeast, it is given that restaurant is located in a city with a population over 500,000.
Answer to Problem 39E
Explanation of Solution
Given:
The following table categorizes 600 outlets of China restaurant by city population, size, and location.
| Population Of City | NE | SE | SW | NW |
| Under 50,000 | 30 | 35 | 15 | 5 |
| 50,000-500,000 | 60 | 90 | 70 | 30 |
| Over 500,000 | 150 | 25 | 30 | 60 |
Formula Used:
Probability of an event is given by
For any two dependent events
Where
Calculation:
Let
Let
So,
Therefore,
So, the probability of the event “the restaurant is in Northeast, it is given that restaurant is located in a city with a population over 500,000” is calculated as follows:
Hence, the probability of the event thatthe restaurant is in Northeast, it is given that restaurant is located in a city with a population over 500,000 is
(b)
The probability restaurant is located in a city with a population under 50,000 it is given that the restaurant is located in the Southeast.
Answer to Problem 39E
Explanation of Solution
Given:
The following table categorizes 600 outlets of China restaurant by city population, size, and location.
| Population Of City | NE | SE | SW | NW |
| Under 50,000 | 30 | 35 | 15 | 5 |
| 50,000-500,000 | 60 | 90 | 70 | 30 |
| Over 500,000 | 150 | 25 | 30 | 60 |
Formula Used:
Probability of an event is given by
For any two dependent events
Where
Calculation:
Let
Let
So,
Therefore,
So, the probability of the event “restaurant is located in a city with a population under 50,000 it is given that the restaurant is located in the Southeast” is calculated as follows:
Hence, the probability restaurant is located in a city with a population under 50,000 it is given that the restaurant is located in the Southeastis
(c)
The probability that the city has a population 500,000 or less, given that restaurant is located in Southwest.
Answer to Problem 39E
The probability that the city has a population 500,000 or less, given that restaurant is located in Southwest is
Explanation of Solution
Given:
The following table categorizes 600 outlets of China restaurant by city population, size, and location.
| Population Of City | NE | SE | SW | NW |
| Under 50,000 | 30 | 35 | 15 | 5 |
| 50,000-500,000 | 60 | 90 | 70 | 30 |
| Over 500,000 | 150 | 25 | 30 | 60 |
Formula Used:
Probability of an event is given by
For any two dependent events
Where
Calculation:
Let
Let
So,
Therefore,
So, the probability of the event that the city has a population 500,000 or less, given that restaurant is located in Southwest” is calculated as follows:
Hence, the probability that the city has a population 500,000 or less, given that restaurant is located in Southwest is
(d)
The probability that the restaurant is in Southwest, it is given that restaurant is located in a city with a population 500,000 or less.
Answer to Problem 39E
Explanation of Solution
Given:
The following table categorizes 600 outlets of China restaurant by city population, size, and location.
| Population Of City | NE | SE | SW | NW |
| Under 50,000 | 30 | 35 | 15 | 5 |
| 50,000-500,000 | 60 | 90 | 70 | 30 |
| Over 500,000 | 150 | 25 | 30 | 60 |
Formula Used:
Probability of an event is given by
For any two dependent events
Where
Calculation:
Let
Let
So,
Therefore,
So, the probability of the event “the restaurant is in Southwest, it is given that restaurant is located in a city with a population 500,000 or less” is calculated as follows:
Hence, the probability of the event thatthe restaurant is in Southwest, it is given that restaurant is located in a city with a population 500,000 or less is
(e)
The probability that the city has a population 50,000 or more, given that restaurant is located in South.
Answer to Problem 39E
The probability that the city has a population 50,000 or more, given that restaurant is located in Southis
Explanation of Solution
Given:
The following table categorizes 600 outlets of China restaurant by city population, size, and location.
| Population Of City | NE | SE | SW | NW |
| Under 50,000 | 30 | 35 | 15 | 5 |
| 50,000-500,000 | 60 | 90 | 70 | 30 |
| Over 500,000 | 150 | 25 | 30 | 60 |
Formula Used:
Probability of an event is given by
For any two dependent events
Where
Calculation:
Let
Let
So,
Therefore,
So, the probability of the event that that “the city has a population 50,000 or more, given that restaurant is located in South” is calculated as follows:
Hence, the probability that that the city has a population 50,000 or more, given that restaurant is located in South is
Want to see more full solutions like this?
Chapter 5 Solutions
Connect Hosted by ALEKS Online Access for Elementary Statistics


- 9. The concentration function of a random variable X is defined as Qx(h) = sup P(x ≤ X ≤x+h), h>0. Show that, if X and Y are independent random variables, then Qx+y (h) min{Qx(h). Qr (h)).arrow_forward10. Prove that, if (t)=1+0(12) as asf->> O is a characteristic function, then p = 1.arrow_forward9. The concentration function of a random variable X is defined as Qx(h) sup P(x ≤x≤x+h), h>0. (b) Is it true that Qx(ah) =aQx (h)?arrow_forward
- 3. Let X1, X2,..., X, be independent, Exp(1)-distributed random variables, and set V₁₁ = max Xk and W₁ = X₁+x+x+ Isk≤narrow_forward7. Consider the function (t)=(1+|t|)e, ER. (a) Prove that is a characteristic function. (b) Prove that the corresponding distribution is absolutely continuous. (c) Prove, departing from itself, that the distribution has finite mean and variance. (d) Prove, without computation, that the mean equals 0. (e) Compute the density.arrow_forward1. Show, by using characteristic, or moment generating functions, that if fx(x) = ½ex, -∞0 < x < ∞, then XY₁ - Y2, where Y₁ and Y2 are independent, exponentially distributed random variables.arrow_forward
- 1. Show, by using characteristic, or moment generating functions, that if 1 fx(x): x) = ½exarrow_forward1990) 02-02 50% mesob berceus +7 What's the probability of getting more than 1 head on 10 flips of a fair coin?arrow_forward9. The concentration function of a random variable X is defined as Qx(h) sup P(x≤x≤x+h), h>0. = x (a) Show that Qx+b(h) = Qx(h).arrow_forward
- Suppose that you buy a lottery ticket, and you have to pick six numbers from 1 through 50 (repetitions allowed). Which combination is more likely to win: 13, 48, 17, 22, 6, 39 or 1, 2, 3, 4, 5, 6? barrow_forward2 Make a histogram from this data set of test scores: 72, 79, 81, 80, 63, 62, 89, 99, 50, 78, 87, 97, 55, 69, 97, 87, 88, 99, 76, 78, 65, 77, 88, 90, and 81. Would a pie chart be appropriate for this data? ganizing Quantitative Data: Charts and Graphs 45arrow_forward10 Meteorologists use computer models to predict when and where a hurricane will hit shore. Suppose they predict that hurricane Stat has a 20 percent chance of hitting the East Coast. a. On what info are the meteorologists basing this prediction? b. Why is this prediction harder to make than your chance of getting a head on your next coin toss? U anoiaarrow_forward

 Algebra & Trigonometry with Analytic GeometryAlgebraISBN:9781133382119Author:SwokowskiPublisher:Cengage
 Holt Mcdougal Larson Pre-algebra: Student Edition...AlgebraISBN:9780547587776Author:HOLT MCDOUGALPublisher:HOLT MCDOUGAL
 College AlgebraAlgebraISBN:9781305115545Author:James Stewart, Lothar Redlin, Saleem WatsonPublisher:Cengage Learning
 College Algebra (MindTap Course List)AlgebraISBN:9781305652231Author:R. David Gustafson, Jeff HughesPublisher:Cengage Learning
 Algebra and Trigonometry (MindTap Course List)AlgebraISBN:9781305071742Author:James Stewart, Lothar Redlin, Saleem WatsonPublisher:Cengage Learning