
Biology (MindTap Course List)
11th Edition
ISBN: 9781337392938
Author: Eldra Solomon, Charles Martin, Diana W. Martin, Linda R. Berg
Publisher: Cengage Learning
expand_more
expand_more
format_list_bulleted
Concept explainers
Videos
Textbook Question
Chapter 53, Problem 20TYU
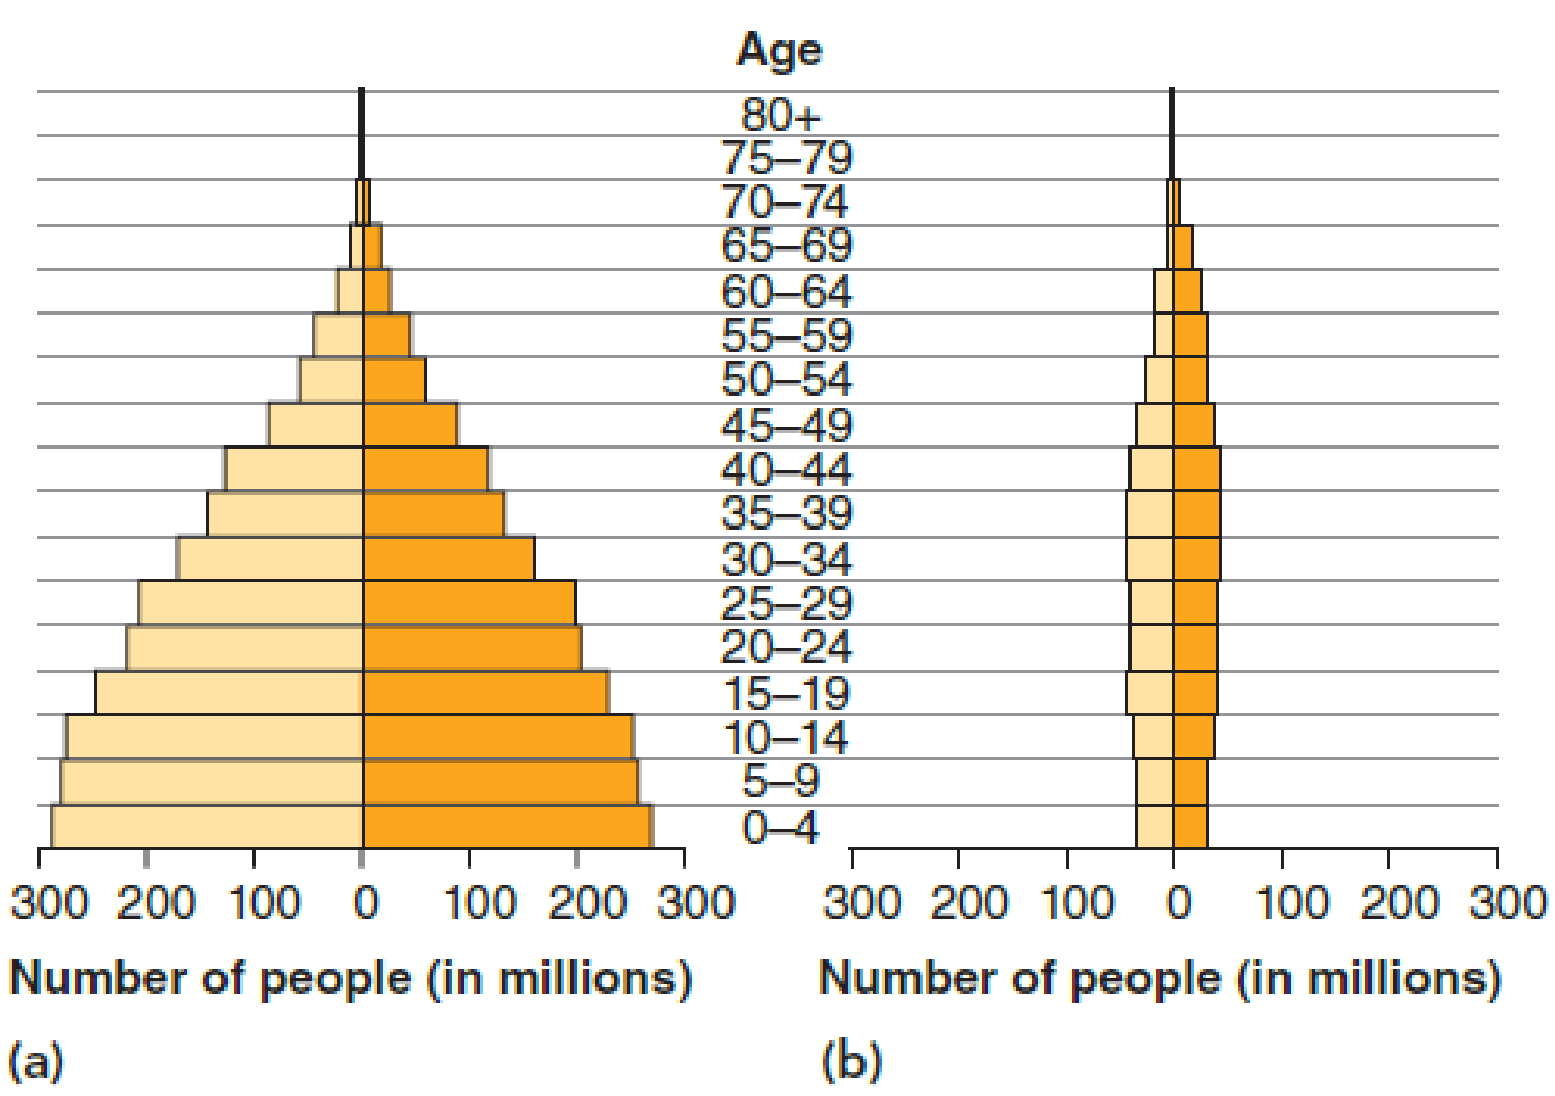
INTERPRET DATA Consider the age structure diagrams for counties (a) and (b). Which diagram is consistent with negative growth momentum? Why?
KEY

Expert Solution & Answer

Trending nowThis is a popular solution!

Students have asked these similar questions
As a medical professional, it is important to be able to discuss how genetic processes such as translation regulation can directly affect patients. Think about some situations that might involve translation regulation.
Respond to the following in a minimum of 175 words:
Why is translation regulation important?
What are some examples of translation regulation in humans?
Select one of the examples you provided and explain what happens when translation regulation goes wrong.
The metabolic pathway below is used for the production of the purine nucleotides adenosine monophosphate (AMP) and guanosine monophosphate (GMP) in eukaryotic cells. Assume each arrow represents a reaction catalyzed by a different enzyme. Using the principles of feedback inhibition, propose a regulatory scheme for this pathway that ensures an adequate supply of both AMP and GMP, and prevents the buildup of Intermediates A through G when supplies of both AMP and GMP are adequate.
QUESTION 27
Label the structures marked A, B, C and explain the role of structure A.
W
plasma membrane
For the toolbar, press ALT+F10 (PC) or ALT+FN+F10 (Mac).
BIUS
☐
Paragraph
Π " ΩΘΗ
Β
Open Sans, a...
10pt
EE
Chapter 53 Solutions
Biology (MindTap Course List)
Ch. 53.1 - Define population density and dispersion, and...Ch. 53.1 - What is the difference between population density...Ch. 53.1 - What are some biological advantages of a clumped...Ch. 53.2 - Prob. 2LOCh. 53.2 - Define intrinsic rate of increase and carrying...Ch. 53.2 - Prob. 1CCh. 53.2 - Prob. 2CCh. 53.2 - Prob. 3CCh. 53.3 - Contrast the influences of density-dependent and...Ch. 53.3 - What are three examples of density-dependent...
Ch. 53.3 - What are three density-independent factors?Ch. 53.4 - Contrast semelparous and iteroparous reproduction.Ch. 53.4 - Distinguish among species exhibiting an r...Ch. 53.4 - Prob. 7LOCh. 53.4 - What are the advantages of semelparity? of...Ch. 53.4 - Prob. 2CCh. 53.4 - Prob. 3CCh. 53.5 - Prob. 8LOCh. 53.5 - Prob. 1CCh. 53.6 - Prob. 9LOCh. 53.6 - Prob. 10LOCh. 53.6 - Distinguish between people overpopulation and...Ch. 53.6 - Prob. 1CCh. 53.6 - Prob. 2CCh. 53.6 - How can a single child born in the United States...Ch. 53 - Population _______________ is the number of...Ch. 53 - The per capita growth rate of a population where...Ch. 53 - The maximum rate at which a population could...Ch. 53 - When r is a positive number, the population size...Ch. 53 - In a graph of population size versus time, a...Ch. 53 - The largest population that can be maintained by a...Ch. 53 - Giant bamboos live many years without reproducing,...Ch. 53 - Predation, disease, and competition are examples...Ch. 53 - _______________ competition occurs within a...Ch. 53 - Prob. 10TYUCh. 53 - Prob. 11TYUCh. 53 - Which of the following patterns of cars parked...Ch. 53 - Prob. 13TYUCh. 53 - Prob. 14TYUCh. 53 - Prob. 15TYUCh. 53 - Prob. 16TYUCh. 53 - Prob. 17TYUCh. 53 - Prob. 18TYUCh. 53 - Prob. 19TYUCh. 53 - INTERPRET DATA Consider the age structure diagrams...Ch. 53 - SCIENCE, TECHNOLOGY, AND SOCIETY In what ways has...
Additional Science Textbook Solutions
Find more solutions based on key concepts
True or false? Some trails are considered vestigial because they existed long ago.
Biological Science (6th Edition)
1. Rub your hands together vigorously. What happens? Discuss the energy transfers and transformations that take...
College Physics: A Strategic Approach (3rd Edition)
What is the pH range for acidic solutions? For basic solutions?
EBK INTRODUCTION TO CHEMISTRY
Single penny tossed 20 times and counting heads and tails: Probability (prediction): _______/20 heads ________/...
Laboratory Manual For Human Anatomy & Physiology
Knowledge Booster


Learn more about
Need a deep-dive on the concept behind this application? Look no further. Learn more about this topic, biology and related others by exploring similar questions and additional content below.Similar questions
- examples of synamptomorphyarrow_forwardexamples of synamtomorphy.arrow_forwardE. Bar Graph Use the same technique to upload the completed image. We will use a different type of graph to derive additional information from the CO2 data (Fig A1.6.2) 1. Calculate the average rate of increase in COz concentration per year for the time intervals 1959-1969, 1969- 1979, etc. and write the results in the spaces provided. The value for 1959-1969 is provided for you as an example. 2. Plot the results as a bar graph. The 1959-1969 is plotted for you. 3. Choose the graph that looks the most like yours A) E BAR GRAPH We will use a different type of graph to derive additional information from the CU, data (rig. nive). Average Yearly Rate of Observatory, Hawall interval Rate of increase per year 1959-1969 0.9 1969-1979 1979-1989 1989-1999 1999-2009 Figure A1.6.2 1999-2009 *- mrame -11- -n4 P2 جية 1989-1999 1979-1989 1969-1979 1959-1969 This bar drawn for you as an example 1.0 CO, Average Increase/Year (ppmv) B) E BAR GRAPH We will use a different type of graph to derive…arrow_forward
- Use the relationships you just described to compute the values needed to fill in the blanks in the table in Fig A1.4.1 depth (a) 1.0 cml 0.7 cml cm| base dimensions (b, c)| 1.0 cm| 1.0 cm| 1.0 cm 1.0 cm| 1.0 cm| 1.0 cm volume (V) 1.0_cm' cm'| cm'| density (p) 1.0 g/cm'| 1.0 g/cm 1.0 g/cm' mass (m)| 0.3 g Column 1: depth at 1.0 cm volume mass Column 2: depth at 0.7 cm volume mass Column 3: unknown depth depth volumearrow_forwardSan Andreas Transform Boundary Plate Motion The geologic map below of southern California shows the position of the famous San Andreas Fault, a transform plate boundary between the North American Plate (east side) and the Pacific Plate (west side). The relative motion between the plates is indicated by the half arrows along the transform plate boundary (i.e., the Pacific Plate is moving to the northwest relative to the North American Plate). Note the two bodies of Oligocene volcanic rocks (labeled Ov) on the map in the previous page located along either side of the San Andreas Fault. These rocks are about 23.5 million years old and were once one body of rock. They have been separated by displacement along the fault. 21. Based on the offset of these volcanic rocks, what is the average annual rate of relative plate motion in cm/yr? SAF lab 2.jpg Group of answer choices 0.67 cm/yr 2 cm/yr 6.7 cm/yr 1.5 cm/yr CALIFORNIA Berkeley San Francisco K Os Q San Andreas Fault Ov…arrow_forwardThese are NOT part of any graded assignment. Are there other examples of synapomorphy. What is it called when the traits retained are similar to ancestors?arrow_forward
- Please hand draw everying. Thank you! Draw a gram positive bacterial cell below. Your cell should have the following parts, labeled: A coccus shape A capsule The gram positive cell wall should have the peptidoglycan labeled, as well as its component parts (NAM, NAG, and teichoic acid) A cell membrane Fimbriae A nucleoid Ribosomes Inclusionsarrow_forwardDraw a gram negative bacterial cell below. Your cell should have the following parts, labeled: A bacillus shape Fimbriae Amphitrichous flagella 2 membranes (outer and inner) The outer membrane should have lipopolysaccharide (LPS) with lipid A and O antigens Periplasmic space The thin peptidoglycan cell wall between the 2 membranes A nucleoid Ribosomes Inclusionsarrow_forwardBacterial species Cell wall type Example: S. mitis Gram positive S. epidermidis H. pylori M. bovis S. marcescens Shape and arrangement Coccus, streptococcus Drawing 0000000arrow_forward
- Draw a gram positive bacterial cell below. Your cell should have the following parts, labeled: A coccus shape A capsule The gram positive cell wall should have the peptidoglycan labeled, as well as its component parts (NAM, NAG, and teichoic acid) A cell membrane Fimbriae A nucleoid Ribosomes Inclusionsarrow_forwardwhat rank is above kingdom? order, class, phylum or domainarrow_forwardin the hierarchy of taconomic categories, with kingdom at the top, what taxon is below classarrow_forward
arrow_back_ios
SEE MORE QUESTIONS
arrow_forward_ios
Recommended textbooks for you
 Biology (MindTap Course List)BiologyISBN:9781337392938Author:Eldra Solomon, Charles Martin, Diana W. Martin, Linda R. BergPublisher:Cengage Learning
 Concepts of BiologyBiologyISBN:9781938168116Author:Samantha Fowler, Rebecca Roush, James WisePublisher:OpenStax College
 Case Studies In Health Information ManagementBiologyISBN:9781337676908Author:SCHNERINGPublisher:Cengage
 Biology 2eBiologyISBN:9781947172517Author:Matthew Douglas, Jung Choi, Mary Ann ClarkPublisher:OpenStax
 Biology: The Unity and Diversity of Life (MindTap...BiologyISBN:9781305073951Author:Cecie Starr, Ralph Taggart, Christine Evers, Lisa StarrPublisher:Cengage Learning
Biology (MindTap Course List)
Biology
ISBN:9781337392938
Author:Eldra Solomon, Charles Martin, Diana W. Martin, Linda R. Berg
Publisher:Cengage Learning
Concepts of Biology
Biology
ISBN:9781938168116
Author:Samantha Fowler, Rebecca Roush, James Wise
Publisher:OpenStax College
Case Studies In Health Information Management
Biology
ISBN:9781337676908
Author:SCHNERING
Publisher:Cengage
Biology 2e
Biology
ISBN:9781947172517
Author:Matthew Douglas, Jung Choi, Mary Ann Clark
Publisher:OpenStax
Biology: The Unity and Diversity of Life (MindTap...
Biology
ISBN:9781305073951
Author:Cecie Starr, Ralph Taggart, Christine Evers, Lisa Starr
Publisher:Cengage Learning
Explore Terrestrial Habitats - Types of Habitats for Children; Author: Smile and Learn - English;https://www.youtube.com/watch?v=vv1indKgOHQ;License: Standard youtube license