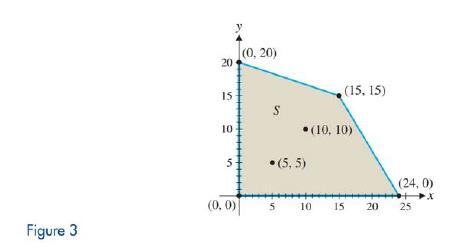
Refer to the feasible region S shown in Figure 3. (A) Let P = x + y . Graph the constant-profit lines through the points 5 , 5 and 10 , 10 . Place a straightedge along the line with the smaller profit and slide it in the direction of increasing profit, without changing its slope. What is the maximum value of P ? Where does this maximum value occur? (B) Repeat part (A) for P = x + 10 y . (C) Repeat part (A) for P = 10 x + y .
Refer to the feasible region S shown in Figure 3. (A) Let P = x + y . Graph the constant-profit lines through the points 5 , 5 and 10 , 10 . Place a straightedge along the line with the smaller profit and slide it in the direction of increasing profit, without changing its slope. What is the maximum value of P ? Where does this maximum value occur? (B) Repeat part (A) for P = x + 10 y . (C) Repeat part (A) for P = 10 x + y .
(A) Let
P
=
x
+
y
. Graph the constant-profit lines through the points
5
,
5
and
10
,
10
. Place a straightedge along the line with the smaller profit and slide it in the direction of increasing profit, without changing its slope. What is the maximum value of
P
? Where does this maximum value occur?
Example 4 (Part 2) We can use Statkey to take 50 different random samples of size 20 each, find the mean of
each sample, and compute a confidence interval for each one. The graph of the sampling distribution of the means
is on the left below, and that of the 50 confidence intervals is on the right.
1. What does each dot on the left hand dotplot represent?
StatKey Sampling Distribution for a Mean
Percent with Internet Access (Countries) ▾
Show Data Table Edit Data
Choose samples of size n =
20
Upload File
Change Column(s)
Generate 1 Sample
Generate 10 Samples
Generate 100 Samples
Generate 1000 Samples
Reset Plot
Sampling Dotplot of Mean
Left Tail Two-Tail Right Tail
60
50
40
40
30
20
20
10
samples = 50
mean = 41.626
std. error = 5.089
:
.:
:
::
0
25
30
35
40
45
50
55
60
41.626
Data Plots
Confidence Intervals
95%->
Confidence Intervals
Coverage
48/50 = 96%
20
40
60
80
2. Circle the confidence intervals that failed to capture the true mean.
3. Circle the sample means that produced those…
Can you prove by induction on n for the following
Chapter 5 Solutions
Finite Mathematics for Business, Economics, Life Sciences, and Social Sciences (13th Edition)
Need a deep-dive on the concept behind this application? Look no further. Learn more about this topic, subject and related others by exploring similar questions and additional content below.
Solve ANY Optimization Problem in 5 Steps w/ Examples. What are they and How do you solve them?; Author: Ace Tutors;https://www.youtube.com/watch?v=BfOSKc_sncg;License: Standard YouTube License, CC-BY
Types of solution in LPP|Basic|Multiple solution|Unbounded|Infeasible|GTU|Special case of LP problem; Author: Mechanical Engineering Management;https://www.youtube.com/watch?v=F-D2WICq8Sk;License: Standard YouTube License, CC-BY


 Algebra & Trigonometry with Analytic GeometryAlgebraISBN:9781133382119Author:SwokowskiPublisher:Cengage
 Algebra for College StudentsAlgebraISBN:9781285195780Author:Jerome E. Kaufmann, Karen L. SchwittersPublisher:Cengage Learning
 Glencoe Algebra 1, Student Edition, 9780079039897...AlgebraISBN:9780079039897Author:CarterPublisher:McGraw Hill
 Algebra: Structure And Method, Book 1AlgebraISBN:9780395977224Author:Richard G. Brown, Mary P. Dolciani, Robert H. Sorgenfrey, William L. ColePublisher:McDougal Littell
 College Algebra (MindTap Course List)AlgebraISBN:9781305652231Author:R. David Gustafson, Jeff HughesPublisher:Cengage Learning