
Concept explainers
Videos
(a)
To find: The value of n and p in the binomial distribution of X.
(a)
Answer to Problem 59E
Solution:
Explanation of Solution
Calculation: The formula of the binomial distributions is:
Here, n is number of trials indefinitely and p is the
So, based on the provided information, the success probability is the probability that the person responds in favor of the research question. And the number of independent trails are the randomly selected persons.
So,
Interpretation: The number of success trials
(b)
To find: The probability of each possible outcomes of X, and the histogram for the distribution
(b)
Answer to Problem 59E
Solution: The probability of each possible value of X is:
| X | |
| 0 | |
| 1 | |
| 2 | |
| 3 | |
| 4 |
Explanation of Solution
Calculation: The probability for
Similarly, the probability for
Similarly, the probability for
Similarly, the probability for
Similarly, the probability for
Therefore, the probability of each possible value of X is,
| X | |
| 0 | |
| 1 | |
| 2 | |
| 3 | |
| 4 |
Graph: The graph of the probability histogram makes by use of the follows steps:
Step 1: Put the data in the excel sheet.
| X | |
| 0 | |
| 1 | |
| 2 | |
| 3 | |
| 4 |
Step 2: Select the data set and go to insert and select the option of cluster column under the Recommended Charts. The screenshot is shown below:
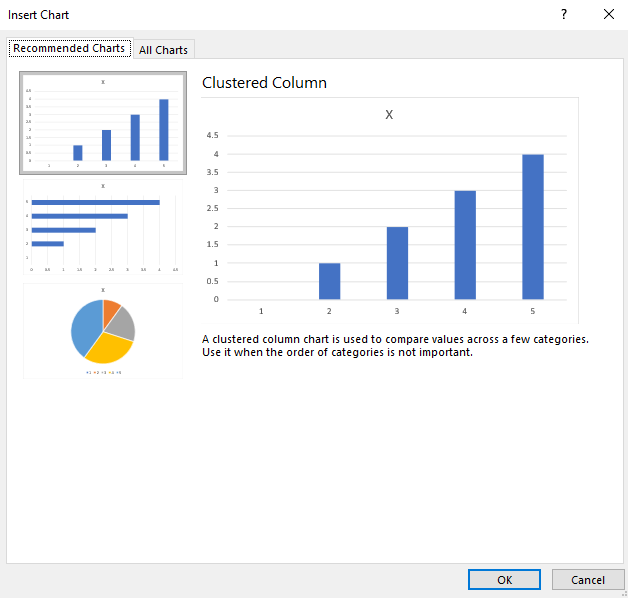
Step 3: Click on OK. The diagram is obtained as:
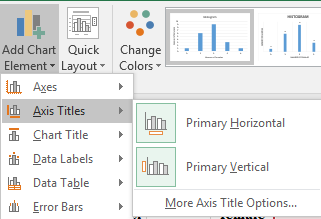
Step 4: Click on the chart area and select the option of “Primary Horizontal” and “Primary Vertical” axis under the “Add Chart Element” to add the axis title. The screenshot is shown below:
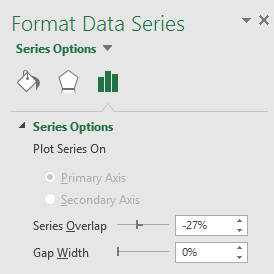
Step 5: Click on the bars of the diagrams and reduce the gap width to zero under the “Format Data Series” tab. The screenshot is shown below:
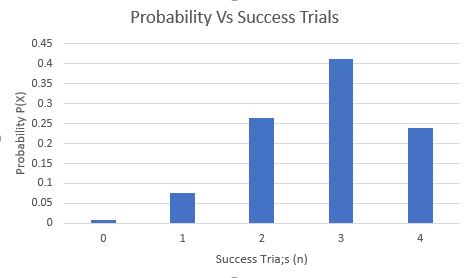
The obtained histogram is:
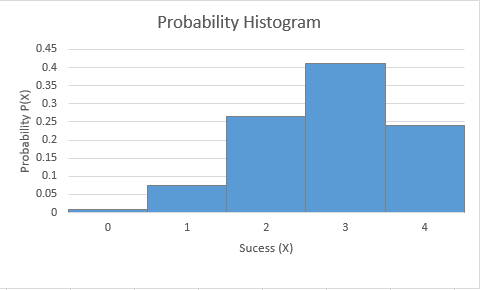
Interpretation: The probability
(c)
To find: The mean number of positive responders and mark the location of this value on your histogram.
(c)
Answer to Problem 59E
Solution: The mean
Explanation of Solution
Calculation: The number of success trials
So, the mean
Graph: The graph of the probability histogram makes by use of the follows steps:
Step 1: Put the data in the excel sheet.
| X | |
| 0 | |
| 1 | |
| 2 | |
| 3 | |
| 4 |
Step 2: Select the data set and go to insert and select the option of cluster column under the Recommended Charts. The screenshot is shown below:
Step 3: Click on OK. The diagram is obtained as:
Step 4: Click on the chart area and select the option of “Primary Horizontal” and “Primary Vertical” axis under the “Add Chart Element” to add the axis title. The screenshot is shown below:
Step 5: Click on the bars of the diagrams and reduce the gap width to zero under the “Format Data Series” tab. The screenshot is shown below:
Step 6: The mean of 2.8 is marked on the histogram and the obtained histogram is:
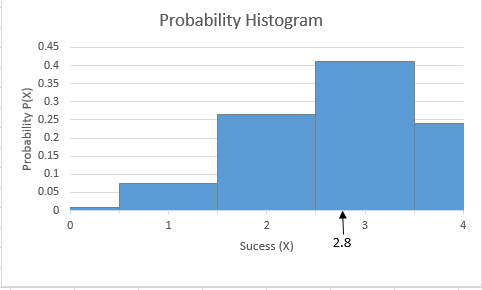
Interpretation: The mean
Want to see more full solutions like this?
Chapter 5 Solutions
LaunchPad for Moore's Introduction to the Practice of Statistics (12 month access)


- 3. A bag of Skittles contains five colors: red, orange, green, yellow, and purple. The probabilities of choosing each color are shown in the chart below. What is the probability of choosing first a red, then a purple, and then a green Skittle, replacing the candies in between picks? Color Probability Red 0.2299 Green 0.1908 Orange 0.2168 Yellow 0.1889 Purple 0.1736arrow_forwardName: Quiz A 5.3-5.4 Sex Female Male Total Happy 90 46 136 Healthy 20 13 33 Rich 10 31 41 Famous 0 8 8 Total 120 98 218 Use the following scenario for questions 1 & 2. One question on the Census at School survey asks students if they would prefer to be happy, healthy, rich, or famous. Students may only choose one of these responses. The two-way table summarizes the responses of 218 high school students from the United States by sex. Preferred status 1. Define event F as a female student and event R as rich. a. Find b. Find or c. Find and 2. Define event F as a female student and event R as rich. a. Find b. Find c. Using your results from a and b, are these events (female student and rich) independent? Use the following scenario for questions 3 & 4. At the end of a 5k race, runners are offered a donut or a banana. The event planner examined each runner's race bib and noted whether Age Less than 30 years old At least 30 years old Total Choice Donut Banana 52 54 106 5 72 77 Total 57 126…arrow_forwardI need help with this problem and an explanation of the solution for the image described below. (Statistics: Engineering Probabilities)arrow_forward
- I need help with this problem and an explanation of the solution for the image described below. (Statistics: Engineering Probabilities)arrow_forwardI need help with this problem and an explanation of the solution for the image described below. (Statistics: Engineering Probabilities)arrow_forwardI need help with this problem and an explanation of the solution for the image described below. (Statistics: Engineering Probabilities)arrow_forward
- I need help with this problem and an explanation of the solution for the image described below. (Statistics: Engineering Probabilities)arrow_forward3. Consider the following regression model: Yi Bo+B1x1 + = ···· + ßpxip + Єi, i = 1, . . ., n, where are i.i.d. ~ N (0,0²). (i) Give the MLE of ẞ and σ², where ẞ = (Bo, B₁,..., Bp)T. (ii) Derive explicitly the expressions of AIC and BIC for the above linear regression model, based on their general formulae.arrow_forwardHow does the width of prediction intervals for ARMA(p,q) models change as the forecast horizon increases? Grows to infinity at a square root rate Depends on the model parameters Converges to a fixed value Grows to infinity at a linear ratearrow_forward
- Consider the AR(3) model X₁ = 0.6Xt-1 − 0.4Xt-2 +0.1Xt-3. What is the value of the PACF at lag 2? 0.6 Not enough information None of these values 0.1 -0.4 이arrow_forwardSuppose you are gambling on a roulette wheel. Each time the wheel is spun, the result is one of the outcomes 0, 1, and so on through 36. Of these outcomes, 18 are red, 18 are black, and 1 is green. On each spin you bet $5 that a red outcome will occur and $1 that the green outcome will occur. If red occurs, you win a net $4. (You win $10 from red and nothing from green.) If green occurs, you win a net $24. (You win $30 from green and nothing from red.) If black occurs, you lose everything you bet for a loss of $6. a. Use simulation to generate 1,000 plays from this strategy. Each play should indicate the net amount won or lost. Then, based on these outcomes, calculate a 95% confidence interval for the total net amount won or lost from 1,000 plays of the game. (Round your answers to two decimal places and if your answer is negative value, enter "minus" sign.) I worked out the Upper Limit, but I can't seem to arrive at the correct answer for the Lower Limit. What is the Lower Limit?…arrow_forwardLet us suppose we have some article reported on a study of potential sources of injury to equine veterinarians conducted at a university veterinary hospital. Forces on the hand were measured for several common activities that veterinarians engage in when examining or treating horses. We will consider the forces on the hands for two tasks, lifting and using ultrasound. Assume that both sample sizes are 6, the sample mean force for lifting was 6.2 pounds with standard deviation 1.5 pounds, and the sample mean force for using ultrasound was 6.4 pounds with standard deviation 0.3 pounds. Assume that the standard deviations are known. Suppose that you wanted to detect a true difference in mean force of 0.25 pounds on the hands for these two activities. Under the null hypothesis, 40 0. What level of type II error would you recommend here? = Round your answer to four decimal places (e.g. 98.7654). Use α = 0.05. β = 0.0594 What sample size would be required? Assume the sample sizes are to be…arrow_forward
 Holt Mcdougal Larson Pre-algebra: Student Edition...AlgebraISBN:9780547587776Author:HOLT MCDOUGALPublisher:HOLT MCDOUGAL
 College Algebra (MindTap Course List)AlgebraISBN:9781305652231Author:R. David Gustafson, Jeff HughesPublisher:Cengage Learning
 Big Ideas Math A Bridge To Success Algebra 1: Stu...AlgebraISBN:9781680331141Author:HOUGHTON MIFFLIN HARCOURTPublisher:Houghton Mifflin Harcourt
 Glencoe Algebra 1, Student Edition, 9780079039897...AlgebraISBN:9780079039897Author:CarterPublisher:McGraw Hill