
Elementary Statistics: Picturing the World (6th Edition)
6th Edition
ISBN: 9780321911216
Author: Ron Larson, Betsy Farber
Publisher: PEARSON
expand_more
expand_more
format_list_bulleted
Concept explainers
Videos
Textbook Question
Chapter 5.2, Problem 21E
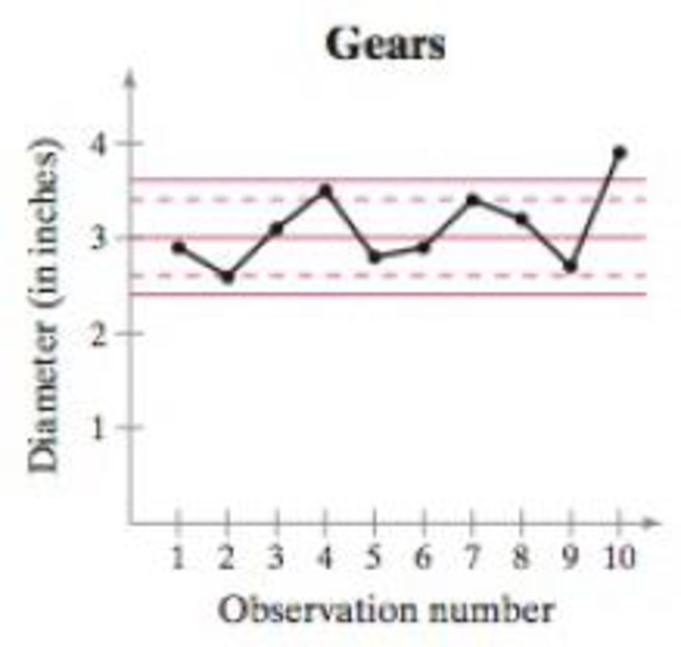
In Exercises 21–24, a control chart is shown. Each chart has horizontal lines drawn at the
21. A gear has been designed to have a diameter of 3 inches. The standard deviation of the process is 0.2 inch.
Expert Solution & Answer
Want to see the full answer?
Check out a sample textbook solution
Students have asked these similar questions
Stem1: 1,4
Stem 2: 2,4,8
Stem3: 2,4
Stem4: 0,1,6,8
Stem5: 0,1,2,3,9
Stem 6: 2,2
What’s the Min,Q1, Med,Q3,Max?
Are the t-statistics here greater than 1.96? What do you conclude?
colgPA= 1.39+0.412 hsGPA
(.33) (0.094)
Find the P value
A poll before the elections showed that in a given sample 79% of people vote for candidate C. How many people should be interviewed so that the pollsters can be 99% sure that from 75% to 83% of the population will vote for candidate C? Round your answer to the whole number.
Chapter 5 Solutions
Elementary Statistics: Picturing the World (6th Edition)
Ch. 5.1 - Prob. 1TYCh. 5.1 - Prob. 2TYCh. 5.1 - Prob. 3TYCh. 5.1 - Prob. 4TYCh. 5.1 - Prob. 5TYCh. 5.1 - Prob. 6TYCh. 5.1 - Find three real-life examples of a continuous...Ch. 5.1 - In a normal distribution, which is greater, the...Ch. 5.1 - What is the total area under the normal curve?Ch. 5.1 - What do the inflection points on a normal...
Ch. 5.1 - Draw two normal curves that have the same mean but...Ch. 5.1 - Draw two normal curves that have different means...Ch. 5.1 - What is the mean of the standard normal...Ch. 5.1 - Describe how you can transform a nonstandard...Ch. 5.1 - Getting at the Concept Why is it correct to say a...Ch. 5.1 - Getting at the Concept A z-score is 0. Which of...Ch. 5.1 - Prob. 11ECh. 5.1 - Prob. 12ECh. 5.1 - Prob. 13ECh. 5.1 - Prob. 14ECh. 5.1 - Prob. 15ECh. 5.1 - Prob. 16ECh. 5.1 - Prob. 17ECh. 5.1 - Prob. 18ECh. 5.1 - Finding Area In Exercises 1722, find the area of...Ch. 5.1 - Prob. 20ECh. 5.1 - Prob. 21ECh. 5.1 - Prob. 22ECh. 5.1 - Prob. 23ECh. 5.1 - Finding Area In Exercises 2336, find the indicated...Ch. 5.1 - Finding Area In Exercises 2336, find the indicated...Ch. 5.1 - Finding Area In Exercises 2336, find the indicated...Ch. 5.1 - Finding Area In Exercises 2336, find the indicated...Ch. 5.1 - Finding Area In Exercises 2336, find the indicated...Ch. 5.1 - Finding Area In Exercises 2336, find the indicated...Ch. 5.1 - Prob. 30ECh. 5.1 - Finding Area In Exercises 2336, find the indicated...Ch. 5.1 - Finding Area In Exercises 2336, find the indicated...Ch. 5.1 - Prob. 33ECh. 5.1 - Finding Area In Exercises 2336, find the indicated...Ch. 5.1 - Finding Area In Exercises 2336, find the indicated...Ch. 5.1 - Finding Area In Exercises 2336, find the indicated...Ch. 5.1 - Manufacturer Claims You work for a consumer...Ch. 5.1 - Milk Consumption You are performing a study about...Ch. 5.1 - Prob. 39ECh. 5.1 - Prob. 40ECh. 5.1 - Finding Probability In Exercises 4146, find the...Ch. 5.1 - Prob. 42ECh. 5.1 - Prob. 43ECh. 5.1 - Finding Probability In Exercises 4146, find the...Ch. 5.1 - Finding Probability In Exercises 4146, find the...Ch. 5.1 - Prob. 46ECh. 5.1 - Prob. 47ECh. 5.1 - Finding Probability In Exercises 4756, find the...Ch. 5.1 - Finding Probability In Exercises 4756, find the...Ch. 5.1 - Finding Probability In Exercises 4756, find the...Ch. 5.1 - Finding Probability In Exercises 4756, find the...Ch. 5.1 - Finding Probability In Exercises 4756, find the...Ch. 5.1 - Prob. 53ECh. 5.1 - Finding Probability In Exercises 4756, find the...Ch. 5.1 - Finding Probability In Exercises 4756, find the...Ch. 5.1 - Prob. 56ECh. 5.1 - Writing Draw a normal curve with a mean of 60 and...Ch. 5.1 - Writing Draw a normal curve with a mean of 450 and...Ch. 5.1 - Prob. 59ECh. 5.1 - Uniform Distribution A uniform distribution is a...Ch. 5.2 - Prob. 1TYCh. 5.2 - Prob. 2TYCh. 5.2 - Computing Probabilities for Normal Distributions...Ch. 5.2 - Computing Probabilities for Normal Distributions...Ch. 5.2 - Computing Probabilities for Normal Distributions...Ch. 5.2 - Computing Probabilities for Normal Distributions...Ch. 5.2 - Computing Probabilities for Normal Distributions...Ch. 5.2 - Computing Probabilities for Normal Distributions...Ch. 5.2 - Prob. 7ECh. 5.2 - Finding Probabilities for Normal Distributions In...Ch. 5.2 - Prob. 9ECh. 5.2 - Prob. 10ECh. 5.2 - Finding Probabilities for Normal Distributions In...Ch. 5.2 - Finding Probabilities for Normal Distributions In...Ch. 5.2 - Prob. 13ECh. 5.2 - Prob. 14ECh. 5.2 - Prob. 15ECh. 5.2 - Prob. 16ECh. 5.2 - Prob. 17ECh. 5.2 - Prob. 18ECh. 5.2 - Prob. 19ECh. 5.2 - Prob. 20ECh. 5.2 - In Exercises 2124, a control chart is shown. Each...Ch. 5.2 - In Exercises 2124, a control chart is shown. Each...Ch. 5.2 - In Exercises 2124, a control chart is shown. Each...Ch. 5.2 - In Exercises 2124, a control chart is shown. Each...Ch. 5.3 - Prob. 1TYCh. 5.3 - Prob. 2TYCh. 5.3 - Prob. 3TYCh. 5.3 - Prob. 4TYCh. 5.3 - Prob. 5TYCh. 5.3 - Finding a z-Score In Exercises 116, use the...Ch. 5.3 - Finding a z-Score In Exercises 116, use the...Ch. 5.3 - Prob. 3ECh. 5.3 - Finding a z-Score In Exercises 116, use the...Ch. 5.3 - Prob. 5ECh. 5.3 - Prob. 6ECh. 5.3 - Prob. 7ECh. 5.3 - Finding a z-Score In Exercises 116, use the...Ch. 5.3 - Prob. 9ECh. 5.3 - Finding a z-Score In Exercises 116, use the...Ch. 5.3 - Finding a z-Score In Exercises 116, use the...Ch. 5.3 - Finding a z-Score In Exercises 116, use the...Ch. 5.3 - Prob. 13ECh. 5.3 - Prob. 14ECh. 5.3 - Prob. 15ECh. 5.3 - Prob. 16ECh. 5.3 - Prob. 17ECh. 5.3 - Prob. 18ECh. 5.3 - Prob. 19ECh. 5.3 - Prob. 20ECh. 5.3 - Prob. 21ECh. 5.3 - Prob. 22ECh. 5.3 - Finding a z-Score Given an Area In Exercises 2330,...Ch. 5.3 - Finding a z-Score Given an Area In Exercises 2330,...Ch. 5.3 - Prob. 25ECh. 5.3 - Prob. 26ECh. 5.3 - Prob. 27ECh. 5.3 - Prob. 28ECh. 5.3 - Prob. 29ECh. 5.3 - Find the positive z-score for which 12% of the...Ch. 5.3 - Prob. 31ECh. 5.3 - Prob. 32ECh. 5.3 - Prob. 33ECh. 5.3 - Prob. 34ECh. 5.3 - Prob. 35ECh. 5.3 - Prob. 36ECh. 5.3 - Prob. 37ECh. 5.3 - Prob. 38ECh. 5.3 - Bags of Baby Carrots The weights of bags of baby...Ch. 5.3 - Writing a Guarantee You sell a brand of automobile...Ch. 5.3 - Vending Machine A vending machine dispenses coffee...Ch. 5.3 - History Grades In a large section of a history...Ch. 5.3 - Prob. 1CSCh. 5.3 - Prob. 2CSCh. 5.3 - Prob. 3CSCh. 5.3 - Prob. 4CSCh. 5.3 - Prob. 5CSCh. 5.4 - Prob. 1TYCh. 5.4 - Prob. 2TYCh. 5.4 - Prob. 3TYCh. 5.4 - Prob. 4TYCh. 5.4 - Prob. 5TYCh. 5.4 - Prob. 6TYCh. 5.4 - In Exercises 14, a population has a mean and a...Ch. 5.4 - Prob. 2ECh. 5.4 - Prob. 3ECh. 5.4 - Prob. 4ECh. 5.4 - True or False? In Exercises 58, determine whether...Ch. 5.4 - True or False? In Exercises 58, determine whether...Ch. 5.4 - True or False? In Exercises 58, determine whether...Ch. 5.4 - True or False? In Exercises 58, determine whether...Ch. 5.4 - Graphical Analysis In Exercises 9 and 10, the...Ch. 5.4 - Graphical Analysis In Exercises 9 and 10, the...Ch. 5.4 - Prob. 11ECh. 5.4 - Prob. 12ECh. 5.4 - Prob. 13ECh. 5.4 - Prob. 14ECh. 5.4 - Finding Probabilities In Exercises 1518, the...Ch. 5.4 - Finding Probabilities In Exercises 1518, the...Ch. 5.4 - Finding Probabilities In Exercises 1518, the...Ch. 5.4 - Finding Probabilities In Exercises 1518, the...Ch. 5.4 - Prob. 19ECh. 5.4 - Prob. 20ECh. 5.4 - Prob. 21ECh. 5.4 - Prob. 22ECh. 5.4 - Prob. 23ECh. 5.4 - Prob. 24ECh. 5.4 - Prob. 25ECh. 5.4 - Prob. 26ECh. 5.4 - Prob. 27ECh. 5.4 - Prob. 28ECh. 5.4 - Prob. 29ECh. 5.4 - Prob. 30ECh. 5.4 - Prob. 31ECh. 5.4 - Prob. 32ECh. 5.4 - Prob. 33ECh. 5.4 - Prob. 34ECh. 5.4 - Prob. 35ECh. 5.4 - Prob. 36ECh. 5.4 - Prob. 37ECh. 5.4 - Prob. 38ECh. 5.4 - Prob. 39ECh. 5.4 - Prob. 40ECh. 5.4 - Sampling Distribution of Sample Proportions For a...Ch. 5.4 - Sampling Distribution of Sample Proportions For a...Ch. 5.4 - Run the simulation using n = 30 and N = 10 for a...Ch. 5.4 - Run the simulation using n = 50 and N = 10 for a...Ch. 5.5 - Prob. 1TYCh. 5.5 - Prob. 2TYCh. 5.5 - Prob. 3TYCh. 5.5 - Prob. 4TYCh. 5.5 - Prob. 5TYCh. 5.5 - In Exercises 14, the sample size n,. probability...Ch. 5.5 - In Exercises 14, the sample size n,. probability...Ch. 5.5 - Prob. 3ECh. 5.5 - Prob. 4ECh. 5.5 - In Exercises 5-8, match the binomial probability...Ch. 5.5 - In Exercises 5-8, match the binomial probability...Ch. 5.5 - In Exercises 5-8, match the binomial probability...Ch. 5.5 - In Exercises 5-8, match the binomial probability...Ch. 5.5 - In Exercises 9-14, write the binomial probability...Ch. 5.5 - In Exercises 9-14, write the binomial probability...Ch. 5.5 - In Exercises 9-14, write the binomial probability...Ch. 5.5 - In Exercises 9-14, write the binomial probability...Ch. 5.5 - In Exercises 9-14, write the binomial probability...Ch. 5.5 - In Exercises 9-14, write the binomial probability...Ch. 5.5 - Graphical Analysis In Exercises 15 and 16, write...Ch. 5.5 - Graphical Analysis In Exercises 15 and 16, write...Ch. 5.5 - Prob. 17ECh. 5.5 - Prob. 18ECh. 5.5 - Prob. 19ECh. 5.5 - Prob. 20ECh. 5.5 - Prob. 21ECh. 5.5 - Prob. 22ECh. 5.5 - Prob. 23ECh. 5.5 - Prob. 24ECh. 5.5 - Prob. 25ECh. 5.5 - Prob. 26ECh. 5.5 - Prob. 27ECh. 5.5 - Prob. 28ECh. 5.5 - Prob. 29ECh. 5.5 - Prob. 30ECh. 5.5 - Getting Physical The figure shows the results of a...Ch. 5.5 - Getting Physical The figure shows the results of a...Ch. 5.5 - Testing a Drug A drug manufacturer claims that a...Ch. 5.5 - Testing a Drug A drug manufacturer claims that a...Ch. 5 - Is It Unusual? A population is normally...Ch. 5 - Find the Error The mean age of students at a high...Ch. 5 - Give an example of a distribution that might be...Ch. 5 - In Exercises I and 2, use the normal curve to...Ch. 5 - In Exercises I and 2, use the normal curve to...Ch. 5 - In Exercises 3 and 4, use the normal curves shown...Ch. 5 - Prob. 5.1.4RECh. 5 - In Exercises 5 and 6, find the area of the...Ch. 5 - In Exercises 5 and 6, find the area of the...Ch. 5 - In Exercises 7-18, find the indicated area under...Ch. 5 - In Exercises 7-18, find the indicated area under...Ch. 5 - In Exercises 7-18, find the indicated area under...Ch. 5 - In Exercises 7-18, find the indicated area under...Ch. 5 - In Exercises 7-18, find the indicated area under...Ch. 5 - In Exercises 7-18, find the indicated area under...Ch. 5 - In Exercises 7-18, find the indicated area under...Ch. 5 - In Exercises 7-18, find the indicated area under...Ch. 5 - In Exercises 7-18, find the indicated area under...Ch. 5 - In Exercises 7-18, find the indicated area under...Ch. 5 - In Exercises 7-18, find the indicated area under...Ch. 5 - In Exercises 7-18, find the indicated area under...Ch. 5 - Prob. 5.1.19RECh. 5 - Prob. 5.1.20RECh. 5 - In Exercises 21-26, find the indicated probability...Ch. 5 - In Exercises 21-26, find the indicated probability...Ch. 5 - In Exercises 21-26, find the indicated probability...Ch. 5 - In Exercises 21-26, find the indicated probability...Ch. 5 - In Exercises 21-26, find the indicated probability...Ch. 5 - In Exercises 21-26, find the indicated probability...Ch. 5 - In Exercises 2732, the random variable x is...Ch. 5 - In Exercises 2732, the random variable x is...Ch. 5 - In Exercises 2732, the random variable x is...Ch. 5 - In Exercises 2732, the random variable x is...Ch. 5 - In Exercises 2732, the random variable x is...Ch. 5 - In Exercises 2732, the random variable x is...Ch. 5 - Prob. 5.2.33RECh. 5 - Prob. 5.2.34RECh. 5 - Prob. 5.2.35RECh. 5 - Prob. 5.2.36RECh. 5 - In Exercises 3742, use the Standard Normal Table...Ch. 5 - In Exercises 3742, use the Standard Normal Table...Ch. 5 - In Exercises 3742, use the Standard Normal Table...Ch. 5 - In Exercises 3742, use the Standard Normal Table...Ch. 5 - In Exercises 3742, use the Standard Normal Table...Ch. 5 - In Exercises 3742, use the Standard Normal Table...Ch. 5 - In Exercises 3742, use the Standard Normal Table...Ch. 5 - In Exercises 3742, use the Standard Normal Table...Ch. 5 - Prob. 5.3.45RECh. 5 - Prob. 5.3.46RECh. 5 - Prob. 5.3.47RECh. 5 - Prob. 5.3.48RECh. 5 - Prob. 5.3.49RECh. 5 - Prob. 5.3.50RECh. 5 - Prob. 5.4.51RECh. 5 - Prob. 5.4.52RECh. 5 - Prob. 5.4.53RECh. 5 - Prob. 5.4.54RECh. 5 - Prob. 5.4.55RECh. 5 - Prob. 5.4.56RECh. 5 - Prob. 5.4.57RECh. 5 - Prob. 5.4.58RECh. 5 - Prob. 5.4.59RECh. 5 - Prob. 5.4.60RECh. 5 - Prob. 5.4.61RECh. 5 - Prob. 5.4.62RECh. 5 - In Exercises 63-68, write the binomial probability...Ch. 5 - In Exercises 63-68, write the binomial probability...Ch. 5 - In Exercises 63-68, write the binomial probability...Ch. 5 - In Exercises 63-68, write the binomial probability...Ch. 5 - In Exercises 63-68, write the binomial probability...Ch. 5 - Prob. 5.5.68RECh. 5 - Prob. 5.5.69RECh. 5 - Prob. 5.5.70RECh. 5 - Prob. 1CQCh. 5 - The random variable x is normally distributed with...Ch. 5 - In a standardized IQ test, scores are normally...Ch. 5 - In a standardized IQ test, scores are normally...Ch. 5 - In a standardized IQ test, scores are normally...Ch. 5 - In a standardized IQ test, scores are normally...Ch. 5 - In a standardized IQ test, scores are normally...Ch. 5 - In a standardized IQ test, scores are normally...Ch. 5 - In a standardized IQ test, scores are normally...Ch. 5 - Are you more likely to randomly select one person...Ch. 5 - Prob. 11CQCh. 5 - Prob. 12CQCh. 5 - Prob. 1CTCh. 5 - In Exercises 2-4, the random variable x is...Ch. 5 - In Exercises 2-4, the random variable x is...Ch. 5 - In Exercises 2-4, the random variable x is...Ch. 5 - Prob. 5CTCh. 5 - Prob. 6CTCh. 5 - Prob. 7CTCh. 5 - Prob. 8CTCh. 5 - Prob. 9CTCh. 5 - Prob. 10CTCh. 5 - Prob. 11CTCh. 5 - EXERCISES 1. Sampling Individuals Assume the...Ch. 5 - Sampling Groups of Five Assume the machine shifts...Ch. 5 - Writing an Explanation Write a paragraph to your...Ch. 5 - Prob. 1CRCh. 5 - Prob. 2CRCh. 5 - Prob. 3CRCh. 5 - Prob. 4CRCh. 5 - From a pool of 16 candidates, 9 men and 7 women,...Ch. 5 - In Exercises 6-11, find the indicated area under...Ch. 5 - In Exercises 6-11, find the indicated area under...Ch. 5 - In Exercises 6-11, find the indicated area under...Ch. 5 - In Exercises 6-11, find the indicated area under...Ch. 5 - Prob. 10CRCh. 5 - In Exercises 6-11, find the indicated area under...Ch. 5 - Prob. 12CRCh. 5 - Prob. 13CRCh. 5 - Prob. 14CRCh. 5 - A survey of adults in the United States found that...Ch. 5 - The life spans of car batteries are normally...Ch. 5 - A florist has 12 different flowers from which...Ch. 5 - Seventy percent of U.S. adults anticipate major...
Knowledge Booster


Learn more about
Need a deep-dive on the concept behind this application? Look no further. Learn more about this topic, statistics and related others by exploring similar questions and additional content below.Similar questions
- Suppose a random sample of 459 married couples found that 307 had two or more personality preferences in common. In another random sample of 471 married couples, it was found that only 31 had no preferences in common. Let p1 be the population proportion of all married couples who have two or more personality preferences in common. Let p2 be the population proportion of all married couples who have no personality preferences in common. Find a95% confidence interval for . Round your answer to three decimal places.arrow_forwardA history teacher interviewed a random sample of 80 students about their preferences in learning activities outside of school and whether they are considering watching a historical movie at the cinema. 69 answered that they would like to go to the cinema. Let p represent the proportion of students who want to watch a historical movie. Determine the maximal margin of error. Use α = 0.05. Round your answer to three decimal places. arrow_forwardA random sample of medical files is used to estimate the proportion p of all people who have blood type B. If you have no preliminary estimate for p, how many medical files should you include in a random sample in order to be 99% sure that the point estimate will be within a distance of 0.07 from p? Round your answer to the next higher whole number.arrow_forward
- A clinical study is designed to assess the average length of hospital stay of patients who underwent surgery. A preliminary study of a random sample of 70 surgery patients’ records showed that the standard deviation of the lengths of stay of all surgery patients is 7.5 days. How large should a sample to estimate the desired mean to within 1 day at 95% confidence? Round your answer to the whole number.arrow_forwardA clinical study is designed to assess the average length of hospital stay of patients who underwent surgery. A preliminary study of a random sample of 70 surgery patients’ records showed that the standard deviation of the lengths of stay of all surgery patients is 7.5 days. How large should a sample to estimate the desired mean to within 1 day at 95% confidence? Round your answer to the whole number.arrow_forwardIn the experiment a sample of subjects is drawn of people who have an elbow surgery. Each of the people included in the sample was interviewed about their health status and measurements were taken before and after surgery. Are the measurements before and after the operation independent or dependent samples?arrow_forward
- iid 1. The CLT provides an approximate sampling distribution for the arithmetic average Ỹ of a random sample Y₁, . . ., Yn f(y). The parameters of the approximate sampling distribution depend on the mean and variance of the underlying random variables (i.e., the population mean and variance). The approximation can be written to emphasize this, using the expec- tation and variance of one of the random variables in the sample instead of the parameters μ, 02: YNEY, · (1 (EY,, varyi n For the following population distributions f, write the approximate distribution of the sample mean. (a) Exponential with rate ẞ: f(y) = ß exp{−ßy} 1 (b) Chi-square with degrees of freedom: f(y) = ( 4 ) 2 y = exp { — ½/ } г( (c) Poisson with rate λ: P(Y = y) = exp(-\} > y! y²arrow_forward2. Let Y₁,……., Y be a random sample with common mean μ and common variance σ². Use the CLT to write an expression approximating the CDF P(Ỹ ≤ x) in terms of µ, σ² and n, and the standard normal CDF Fz(·).arrow_forwardmatharrow_forward
- Compute the median of the following data. 32, 41, 36, 42, 29, 30, 40, 22, 25, 37arrow_forwardTask Description: Read the following case study and answer the questions that follow. Ella is a 9-year-old third-grade student in an inclusive classroom. She has been diagnosed with Emotional and Behavioural Disorder (EBD). She has been struggling academically and socially due to challenges related to self-regulation, impulsivity, and emotional outbursts. Ella's behaviour includes frequent tantrums, defiance toward authority figures, and difficulty forming positive relationships with peers. Despite her challenges, Ella shows an interest in art and creative activities and demonstrates strong verbal skills when calm. Describe 2 strategies that could be implemented that could help Ella regulate her emotions in class (4 marks) Explain 2 strategies that could improve Ella’s social skills (4 marks) Identify 2 accommodations that could be implemented to support Ella academic progress and provide a rationale for your recommendation.(6 marks) Provide a detailed explanation of 2 ways…arrow_forwardQuestion 2: When John started his first job, his first end-of-year salary was $82,500. In the following years, he received salary raises as shown in the following table. Fill the Table: Fill the following table showing his end-of-year salary for each year. I have already provided the end-of-year salaries for the first three years. Calculate the end-of-year salaries for the remaining years using Excel. (If you Excel answer for the top 3 cells is not the same as the one in the following table, your formula / approach is incorrect) (2 points) Geometric Mean of Salary Raises: Calculate the geometric mean of the salary raises using the percentage figures provided in the second column named “% Raise”. (The geometric mean for this calculation should be nearly identical to the arithmetic mean. If your answer deviates significantly from the mean, it's likely incorrect. 2 points) Starting salary % Raise Raise Salary after raise 75000 10% 7500 82500 82500 4% 3300…arrow_forward
arrow_back_ios
SEE MORE QUESTIONS
arrow_forward_ios
Recommended textbooks for you
 Big Ideas Math A Bridge To Success Algebra 1: Stu...AlgebraISBN:9781680331141Author:HOUGHTON MIFFLIN HARCOURTPublisher:Houghton Mifflin Harcourt
 Glencoe Algebra 1, Student Edition, 9780079039897...AlgebraISBN:9780079039897Author:CarterPublisher:McGraw Hill
 Functions and Change: A Modeling Approach to Coll...AlgebraISBN:9781337111348Author:Bruce Crauder, Benny Evans, Alan NoellPublisher:Cengage Learning
Big Ideas Math A Bridge To Success Algebra 1: Stu...
Algebra
ISBN:9781680331141
Author:HOUGHTON MIFFLIN HARCOURT
Publisher:Houghton Mifflin Harcourt
Glencoe Algebra 1, Student Edition, 9780079039897...
Algebra
ISBN:9780079039897
Author:Carter
Publisher:McGraw Hill
Functions and Change: A Modeling Approach to Coll...
Algebra
ISBN:9781337111348
Author:Bruce Crauder, Benny Evans, Alan Noell
Publisher:Cengage Learning
The Shape of Data: Distributions: Crash Course Statistics #7; Author: CrashCourse;https://www.youtube.com/watch?v=bPFNxD3Yg6U;License: Standard YouTube License, CC-BY
Shape, Center, and Spread - Module 20.2 (Part 1); Author: Mrmathblog;https://www.youtube.com/watch?v=COaid7O_Gag;License: Standard YouTube License, CC-BY
Shape, Center and Spread; Author: Emily Murdock;https://www.youtube.com/watch?v=_YyW0DSCzpM;License: Standard Youtube License