Campbell Biology, Books a la Carte Plus Mastering Biology with eText -- Access Card Package (10th Edition)
10th Edition
ISBN: 9780133922851
Author: Jane B. Reece, Lisa A. Urry, Michael L. Cain, Steven A. Wasserman, Peter V. Minorsky, Robert B. Jackson
Publisher: PEARSON
expand_more
expand_more
format_list_bulleted
Concept explainers
Videos
Textbook Question
Chapter 52, Problem 14TYU
SYNTHESIZE YOUR KNOWLEDGE
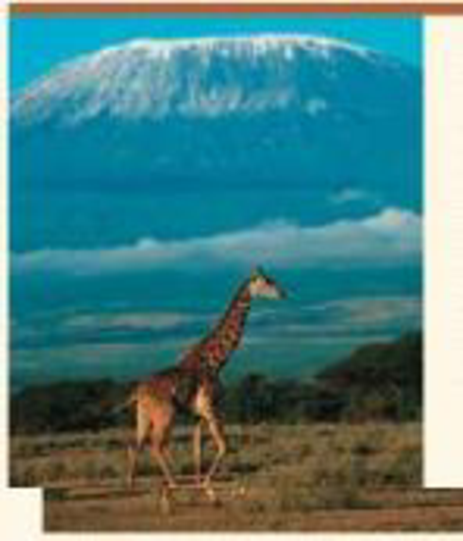
If you were to hike up Mount Kilimanjaro in Tanzania, you would pass through several habitats, including savanna at the base, forest on the slopes, and alpine tundra near the top. Explain how such diverse habitats can be found at one location near the equator.
Expert Solution & Answer
Want to see the full answer?
Check out a sample textbook solution
Students have asked these similar questions
What are biofertilizers and mention the significance
PCBs and River Otters: Otters in Washington State’s Green-Duwamish River have high levels of polychlorinated biphenyls (PCBs) in their livers. PCBs can bind to the estrogen receptors in animals and disrupt the endocrine system of these otters. The PCBs seem to increase the estrogen to androgen ratio, skewing the ratio toward too much estrogen.
How would increased estrogen affect the river otter population?
Based on your reading of the materials in this unit, what factors can affect fertility in humans?
Explain how each of the factors affecting human fertility that you described can disrupt the human endocrine system to affect reproduction.
Other than oil and alcohol, are there other liquids you could compare to water (that are liquid at room temperature)?
How is water unique compared to these other liquids?
What follow-up experiment would you like to do, and how would you relate it to your life?
Chapter 52 Solutions
Campbell Biology, Books a la Carte Plus Mastering Biology with eText -- Access Card Package (10th Edition)
Ch. 52.1 - Explain how the sun's unequal heating of Earth's...Ch. 52.1 - What are some of the differences in microclimate...Ch. 52.1 - WHAT IF? Changes in Earth's climate at the end of...Ch. 52.1 - MAKE CONNECTIONS Focusing just on the effects of...Ch. 52.2 - Based on the climograph in Figure 52.10, what...Ch. 52.2 - Using Figure 52.12, identify the natural biome in...Ch. 52.2 - WHAT IF? If global warming increases average...Ch. 52.3 - Prob. 1CCCh. 52.3 - Prob. 2CCCh. 52.3 - Prob. 3CC
Ch. 52.4 - Give examples of human actions that could expand a...Ch. 52.4 - WHAT IF? You suspect that deer are restricting...Ch. 52.4 - Prob. 3CCCh. 52 - Suppose global air circulation suddenly reversed,...Ch. 52 - Prob. 52.2CRCh. 52 - Prob. 52.3CRCh. 52 - Interactions between organisms and the environment...Ch. 52 - Level 1: Knowledge/Comprehension 1. Which of the...Ch. 52 - Which lake zone would be absent in a very shallow...Ch. 52 - Prob. 3TYUCh. 52 - Which of the following is characteristic of most...Ch. 52 - The oceans affect the biosphere in all of the...Ch. 52 - Which statement about dispersal is false? (A)...Ch. 52 - When climbing a mountain, we can observe...Ch. 52 - Prob. 8TYUCh. 52 - Prob. 9TYUCh. 52 - Prob. 10TYUCh. 52 - Prob. 11TYUCh. 52 - SCIENTIFIC INQUIRY Jens Clausen and colleagues, at...Ch. 52 - WRITE ABOUT A THEME: INTERACTIONS Global warming...Ch. 52 - SYNTHESIZE YOUR KNOWLEDGE If you were to hike up...
Knowledge Booster


Learn more about
Need a deep-dive on the concept behind this application? Look no further. Learn more about this topic, biology and related others by exploring similar questions and additional content below.Similar questions
- Selection of Traits What adaptations do scavengers have for locating and feeding on prey? What adaptations do predators have for capturing and consuming prey?arrow_forwardCompetition Between Species What natural processes limit populations from growing too large? What are some resources organisms can compete over in their natural habitat?arrow_forwardSpecies Interactions Explain how predators, prey and scavengers interact. Explain whether predators and scavengers are necessary or beneficial for an ecosystem.arrow_forward
- magine that you are conducting research on fruit type and seed dispersal. You submitted a paper to a peer-reviewed journal that addresses the factors that impact fruit type and seed dispersal mechanisms in plants of Central America. The editor of the journal communicates that your paper may be published if you make ‘minor revisions’ to the document. Describe two characteristics that you would expect in seeds that are dispersed by the wind. Contrast this with what you would expect for seeds that are gathered, buried or eaten by animals, and explain why they are different. (Editor’s note: Providing this information in your discussion will help readers to consider the significance of the research).arrow_forwardWhat is the difference between Uniporters, Symporters and Antiporters? Which of these are examples of active transport?arrow_forwardWhat are coupled transporters?arrow_forward
- How do histamine and prostaglandins help in the mobilization of leukocytes to an injury site? What are chemotactic factors? How do they affect inflammation process?arrow_forwardCompare and contrast neutrophils and macrophages. Describe two ways they are different and two ways they are similar.arrow_forwardDescribe the effects of three cytokines (not involved in the initial inflammation response). What cells release them?arrow_forward
arrow_back_ios
SEE MORE QUESTIONS
arrow_forward_ios
Recommended textbooks for you
 Biology (MindTap Course List)BiologyISBN:9781337392938Author:Eldra Solomon, Charles Martin, Diana W. Martin, Linda R. BergPublisher:Cengage Learning
Biology (MindTap Course List)
Biology
ISBN:9781337392938
Author:Eldra Solomon, Charles Martin, Diana W. Martin, Linda R. Berg
Publisher:Cengage Learning
Chapter 5 Microbial Metabolism; Author: Heather Davis;https://www.youtube.com/watch?v=wH_HrsfDWZw;License: Standard Youtube License