
An Introduction to Statistical Methods and Data Analysis
7th Edition
ISBN: 9781305269477
Author: R. Lyman Ott, Micheal T. Longnecker
Publisher: Cengage Learning
expand_more
expand_more
format_list_bulleted
Concept explainers
Videos
Textbook Question
Chapter 5.12, Problem 39E
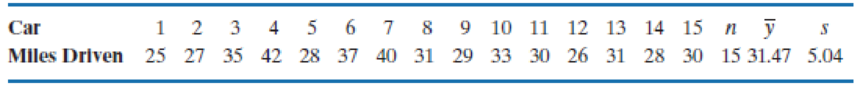
A consumer testing agency wants to evaluate the claim made by a manufacturer of discount tires. The manufacturer claims that its tires can be driven at least 35,000 miles before wearing out. To determine the average number of miles that can be obtained from the manufacturer’s tires, the agency randomly selects 60 tires from the manufacturer’s warehouse and places the tires on 15 cars driven by test drivers on a 2-mile oval track. The number of miles driven (in thousands of miles) until the tires are determined to be worn out is given in the following table.
- a. Place a 99% confidence interval on the average number of miles driven, μ, prior to the tires wearing out.
- b. Is there significant evidence (α = .01) that the manufacturer’s claim is false? What is the level of significance of your test? Interpret your findings.
Expert Solution & Answer
Want to see the full answer?
Check out a sample textbook solution
Students have asked these similar questions
Elementary StatisticsBase on the same given data uploaded in module 4, will you conclude that the number of bathroom of houses is a significant factor for house sellprice? I your answer is affirmative, you need to explain how the number of bathroom influences the house price, using a post hoc procedure. (Please treat number of bathrooms as a categorical variable in this analysis)Base on the same given data, conduct an analysis for the variable sellprice to see if sale price is influenced by living area. Summarize your finding including all regular steps (learned in this module) for your method. Also, will you conclude that larger house corresponding to higher price (justify)?Each question need to include a spss or sas output.
Instructions:
You have to use SAS or SPSS to perform appropriate procedure: ANOVA or Regression based on the project data (provided in the module 4) and research question in the project file. Attach the computer output of all key steps (number) quoted in…
Elementary StatsBase on the given data uploaded in module 4, change the variable sale price into two categories: abovethe mean price or not; and change the living area into two categories: above the median living area ornot ( your two group should have close number of houses in each group). Using the resulting variables,will you conclude that larger house corresponding to higher price?Note: Need computer output, Ho and Ha, P and decision. If p is small, you need to explain what type ofdependency (association) we have using an appropriate pair of percentages.
Please include how to use the data in SPSS and interpretation of data.
An environmental research team is studying the daily rainfall (in millimeters) in a region over 100 days.
The data is grouped into the following histogram bins:
Rainfall Range (mm) Frequency
0-9.9
15
10 19.9
25
20-29.9
30
30-39.9
20
||40-49.9
10
a) If a random day is selected, what is the probability that the rainfall was at least 20 mm but less than 40
mm?
b) Estimate the mean daily rainfall, assuming the rainfall in each bin is uniformly distributed and the
midpoint of each bin represents the average rainfall for that range.
c) Construct the cumulative frequency distribution and determine the rainfall level below which 75% of the
days fall.
d) Calculate the estimated variance and standard deviation of the daily rainfall based on the histogram data.
Chapter 5 Solutions
An Introduction to Statistical Methods and Data Analysis
Ch. 5.12 - The county government in a city that is dominated...Ch. 5.12 - In the research study on percentage of calories...Ch. 5.12 - Face masks used by firefighters often fail by...Ch. 5.12 - Refer to Exercise 5.3. Describe a process to...Ch. 5.12 - A company that manufacturers coffee for use in...Ch. 5.12 - Refer to Exercise 5.5. The engineer in charge of...Ch. 5.12 - Refer to Exercise 5.5. Because the company is...Ch. 5.12 - As part of the recruitment of new businesses, the...Ch. 5.12 - A program to reduce recidivism has been in effect...Ch. 5.12 - The susceptibility of the root stocks of a variety...
Ch. 5.12 - Prob. 11ECh. 5.12 - In any given situation, if the level of confidence...Ch. 5.12 - A biologist wishes to estimate the effect of an...Ch. 5.12 - Refer to Exercise 5.14. Suppose the mayors staff...Ch. 5.12 - Refer to Exercise 5.14. Suppose the mayors staff...Ch. 5.12 - A study is designed to test the hypotheses H0: ...Ch. 5.12 - Refer to Exercise 5.16. Graph the power curve for...Ch. 5.12 - A study was conducted of 90 adult male patients...Ch. 5.12 - Prob. 22ECh. 5.12 - A national agency sets recommended daily dietary...Ch. 5.12 - To evaluate the success of a 1-year experimental...Ch. 5.12 - Refer to Exercise 5.24. Suppose a random sample of...Ch. 5.12 - The administrator of a nursing home would like to...Ch. 5.12 - The vulnerability of inshore environments to...Ch. 5.12 - The RD department of a paint company has developed...Ch. 5.12 - Prob. 29ECh. 5.12 - A concern to public health officials is whether a...Ch. 5.12 - Prob. 31ECh. 5.12 - Prob. 32ECh. 5.12 - Prob. 33ECh. 5.12 - Provide the rejection region based on a t-test...Ch. 5.12 - A study was designed to evaluate whether the...Ch. 5.12 -
The ability to read rapidly and simultaneously...Ch. 5.12 - Refer to Exercise 5.36. Using the reading...Ch. 5.12 -
Refer to Exercise 5.36.
Does there appear to be a...Ch. 5.12 - A consumer testing agency wants to evaluate the...Ch. 5.12 -
Refer to Exercise 5.39.
Does the normality of the...Ch. 5.12 - The amount of sewage and industrial pollutants...Ch. 5.12 - A dealer in recycled paper places empty trailers...Ch. 5.12 - Prob. 47ECh. 5.12 - Prob. 48ECh. 5.12 - Prob. 49ECh. 5.12 - Prob. 50ECh. 5.12 - Prob. 51ECh. 5.12 - Prob. 52ECh. 5.12 - Prob. 53ECh. 5.12 - Prob. 54ECh. 5.12 - Prob. 55ECh. 5.12 - Prob. 56ECh. 5.12 - Prob. 57SECh. 5.12 - The concentration of mercury in a lake has been...Ch. 5.12 -
In a standard dissolution test for tablets of a...Ch. 5.12 - Prob. 60SECh. 5.12 -
Over the past 5 years, the mean time for a...Ch. 5.12 - If a new process for mining copper is to be put...Ch. 5.12 - Prob. 63SECh. 5.12 - Prob. 64SECh. 5.12 - Prob. 65SECh. 5.12 - Prob. 66SECh. 5.12 - Prob. 67SECh. 5.12 - Prob. 68SECh. 5.12 - Prob. 69SECh. 5.12 - Prob. 70SECh. 5.12 - Prob. 71SECh. 5.12 - Prob. 73SECh. 5.12 - Prob. 74SECh. 5.12 - Prob. 75SECh. 5.12 - Prob. 76SE
Knowledge Booster


Learn more about
Need a deep-dive on the concept behind this application? Look no further. Learn more about this topic, statistics and related others by exploring similar questions and additional content below.Similar questions
- An electronics company manufactures batches of n circuit boards. Before a batch is approved for shipment, m boards are randomly selected from the batch and tested. The batch is rejected if more than d boards in the sample are found to be faulty. a) A batch actually contains six faulty circuit boards. Find the probability that the batch is rejected when n = 20, m = 5, and d = 1. b) A batch actually contains nine faulty circuit boards. Find the probability that the batch is rejected when n = 30, m = 10, and d = 1.arrow_forwardTwenty-eight applicants interested in working for the Food Stamp program took an examination designed to measure their aptitude for social work. A stem-and-leaf plot of the 28 scores appears below, where the first column is the count per branch, the second column is the stem value, and the remaining digits are the leaves. a) List all the values. Count 1 Stems Leaves 4 6 1 4 6 567 9 3688 026799 9 8 145667788 7 9 1234788 b) Calculate the first quartile (Q1) and the third Quartile (Q3). c) Calculate the interquartile range. d) Construct a boxplot for this data.arrow_forwardPam, Rob and Sam get a cake that is one-third chocolate, one-third vanilla, and one-third strawberry as shown below. They wish to fairly divide the cake using the lone chooser method. Pam likes strawberry twice as much as chocolate or vanilla. Rob only likes chocolate. Sam, the chooser, likes vanilla and strawberry twice as much as chocolate. In the first division, Pam cuts the strawberry piece off and lets Rob choose his favorite piece. Based on that, Rob chooses the chocolate and vanilla parts. Note: All cuts made to the cake shown below are vertical.Which is a second division that Rob would make of his share of the cake?arrow_forward
- Three players (one divider and two choosers) are going to divide a cake fairly using the lone divider method. The divider cuts the cake into three slices (s1, s2, and s3). If the choosers' declarations are Chooser 1: {s1 , s2} and Chooser 2: {s2 , s3}. Using the lone-divider method, how many different fair divisions of this cake are possible?arrow_forwardTheorem 2.6 (The Minkowski inequality) Let p≥1. Suppose that X and Y are random variables, such that E|X|P <∞ and E|Y P <00. Then X+YpX+Yparrow_forwardTheorem 1.2 (1) Suppose that P(|X|≤b) = 1 for some b > 0, that EX = 0, and set Var X = 0². Then, for 0 0, P(X > x) ≤e-x+1²² P(|X|>x) ≤2e-1x+1²² (ii) Let X1, X2...., Xn be independent random variables with mean 0, suppose that P(X ≤b) = 1 for all k, and set oσ = Var X. Then, for x > 0. and 0x) ≤2 exp Σ k=1 (iii) If, in addition, X1, X2, X, are identically distributed, then P(S|x) ≤2 expl-tx+nt²o).arrow_forward
- Theorem 5.1 (Jensen's inequality) state without proof the Jensen's Ineg. Let X be a random variable, g a convex function, and suppose that X and g(X) are integrable. Then g(EX) < Eg(X).arrow_forwardCan social media mistakes hurt your chances of finding a job? According to a survey of 1,000 hiring managers across many different industries, 76% claim that they use social media sites to research prospective candidates for any job. Calculate the probabilities of the following events. (Round your answers to three decimal places.) answer parts a-c. a) Out of 30 job listings, at least 19 will conduct social media screening. b) Out of 30 job listings, fewer than 17 will conduct social media screening. c) Out of 30 job listings, exactly between 19 and 22 (including 19 and 22) will conduct social media screening. show all steps for probabilities please. answer parts a-c.arrow_forwardQuestion: we know that for rt. (x+ys s ا. 13. rs. and my so using this, show that it vye and EIXI, EIYO This : E (IX + Y) ≤2" (EIX (" + Ely!")arrow_forward
- Theorem 2.4 (The Hölder inequality) Let p+q=1. If E|X|P < ∞ and E|Y| < ∞, then . |EXY ≤ E|XY|||X|| ||||qarrow_forwardTheorem 7.6 (Etemadi's inequality) Let X1, X2, X, be independent random variables. Then, for all x > 0, P(max |S|>3x) ≤3 max P(S| > x). Isk≤narrow_forwardTheorem 7.2 Suppose that E X = 0 for all k, that Var X = 0} x) ≤ 2P(S>x 1≤k≤n S√2), -S√2). P(max Sk>x) ≤ 2P(|S|>x- 1arrow_forwardarrow_back_iosSEE MORE QUESTIONSarrow_forward_ios
Recommended textbooks for you
 Algebra: Structure And Method, Book 1AlgebraISBN:9780395977224Author:Richard G. Brown, Mary P. Dolciani, Robert H. Sorgenfrey, William L. ColePublisher:McDougal Littell
 Holt Mcdougal Larson Pre-algebra: Student Edition...AlgebraISBN:9780547587776Author:HOLT MCDOUGALPublisher:HOLT MCDOUGAL
 Big Ideas Math A Bridge To Success Algebra 1: Stu...AlgebraISBN:9781680331141Author:HOUGHTON MIFFLIN HARCOURTPublisher:Houghton Mifflin Harcourt
 Glencoe Algebra 1, Student Edition, 9780079039897...AlgebraISBN:9780079039897Author:CarterPublisher:McGraw Hill

Algebra: Structure And Method, Book 1
Algebra
ISBN:9780395977224
Author:Richard G. Brown, Mary P. Dolciani, Robert H. Sorgenfrey, William L. Cole
Publisher:McDougal Littell
Holt Mcdougal Larson Pre-algebra: Student Edition...
Algebra
ISBN:9780547587776
Author:HOLT MCDOUGAL
Publisher:HOLT MCDOUGAL
Big Ideas Math A Bridge To Success Algebra 1: Stu...
Algebra
ISBN:9781680331141
Author:HOUGHTON MIFFLIN HARCOURT
Publisher:Houghton Mifflin Harcourt
Glencoe Algebra 1, Student Edition, 9780079039897...
Algebra
ISBN:9780079039897
Author:Carter
Publisher:McGraw Hill
Hypothesis Testing - Solving Problems With Proportions; Author: The Organic Chemistry Tutor;https://www.youtube.com/watch?v=76VruarGn2Q;License: Standard YouTube License, CC-BY
Hypothesis Testing and Confidence Intervals (FRM Part 1 – Book 2 – Chapter 5); Author: Analystprep;https://www.youtube.com/watch?v=vth3yZIUlGQ;License: Standard YouTube License, CC-BY