
Statistical Reasoning for Everyday Life Plus MyLab Statistics with Pearson eText -- 18 Week Access Card Package (5th Edition)
5th Edition
ISBN: 9780135990278
Author: Bennett, Jeffrey O., Briggs, William L., Triola, Mario F.
Publisher: PEARSON
expand_more
expand_more
format_list_bulleted
Concept explainers
Videos
Textbook Question
Chapter 5.1, Problem 24E
Areas and Relative Frequencies. Consider the graph of the
a. What is the total area under the curve?
b. Estimate (using area) the relative frequency of values less than 100.
c. Estimate the relative frequency of values greater than 110.
d. Estimate the relative frequency of values less than 110.
e. Estimate the relative frequency of values between 100 and 110.
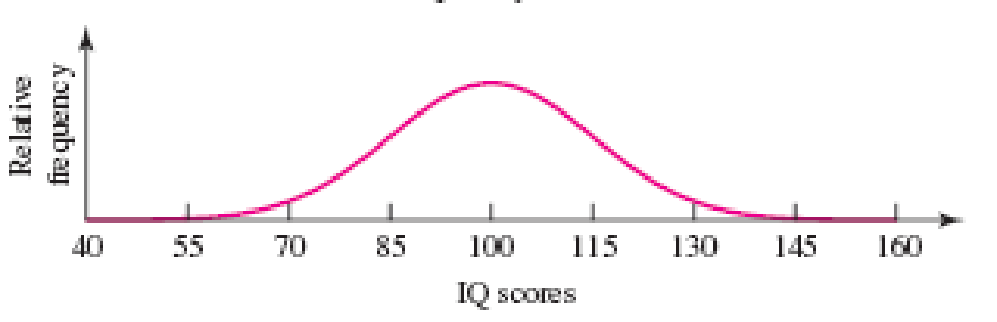
Figure 5.13
Expert Solution & Answer
Want to see the full answer?
Check out a sample textbook solution
Students have asked these similar questions
Stem1: 1,4
Stem 2: 2,4,8
Stem3: 2,4
Stem4: 0,1,6,8
Stem5: 0,1,2,3,9
Stem 6: 2,2
What’s the Min,Q1, Med,Q3,Max?
Are the t-statistics here greater than 1.96? What do you conclude?
colgPA= 1.39+0.412 hsGPA
(.33) (0.094)
Find the P value
A poll before the elections showed that in a given sample 79% of people vote for candidate C. How many people should be interviewed so that the pollsters can be 99% sure that from 75% to 83% of the population will vote for candidate C? Round your answer to the whole number.
Chapter 5 Solutions
Statistical Reasoning for Everyday Life Plus MyLab Statistics with Pearson eText -- 18 Week Access Card Package (5th Edition)
Ch. 5.1 - Normal Distribution. When we refer to a normal...Ch. 5.1 - Normal Shape. Draw a rough sketch of a normal...Ch. 5.1 - Area Under the Curve. What does the area under the...Ch. 5.1 - Normal Conditions. Briefly describe the four...Ch. 5.1 - Does It Make Sense? For Exercises 58, determine...Ch. 5.1 - Does It Make Sense? For Exercises 58, determine...Ch. 5.1 - Does It Make Sense? For Exercises 58, determine...Ch. 5.1 - Does It Make Sense? For Exercises 58, determine...Ch. 5.1 - What Is Normal? Identify the distribution in...Ch. 5.1 - What Is Normal? Identify the distribution in...
Ch. 5.1 - Normal Distributions. For each of the data sets in...Ch. 5.1 - Normal Distributions. For each of the data sets in...Ch. 5.1 - Normal Distributions. For each of the data sets in...Ch. 5.1 - Normal Distributions. For each of the data sets in...Ch. 5.1 - Normal Distributions. For each of the data sets in...Ch. 5.1 - Normal Distributions. For each of the data sets in...Ch. 5.1 - Normal Distributions. For each of the data sets in...Ch. 5.1 - Normal Distributions. For each of the data sets in...Ch. 5.1 - Body Temperature. Figure 5.8 shows a histogram for...Ch. 5.1 - Cotinine. The amount of nicotine absorbed by the...Ch. 5.1 - Departure Delay Times. Figure 5.10 on the next...Ch. 5.1 - MM Weights. Figure 5.11 shows a histogram for the...Ch. 5.1 - Areas and Relative Frequencies. Consider the graph...Ch. 5.1 - Areas and Relative Frequencies. Consider the graph...Ch. 5.1 - Estimating Areas. Consider the graph of the normal...Ch. 5.1 - Prob. 26ECh. 5.2 - The 68-95-99.7 Rule. What is the 68-95-99.7 rule...Ch. 5.2 - Applying the 68-95-99.7 Rule. For a normal...Ch. 5.2 - Standard Score. What is a standard score? How do...Ch. 5.2 - Percentiles. What is a percentile? Describe how...Ch. 5.2 - Does It Make Sense? For Exercises 58, determine...Ch. 5.2 - Does It Make Sense? For Exercises 58, determine...Ch. 5.2 - Does It Make Sense? For Exercises 58, determine...Ch. 5.2 - Does It Make Sense? For Exercises 58, determine...Ch. 5.2 - Using the 68-95-99.7 Rule. A test of depth...Ch. 5.2 - Using the 68-95-99.7 Rule. Pulse rates for adult...Ch. 5.2 - Applying the 68-95-99.7 Rule. In a study of facial...Ch. 5.2 - Applying the 68-95-99.7 Rule. Adult males have...Ch. 5.2 - IQ Scores. For Exercises 1324, sketch the normal...Ch. 5.2 - IQ Scores. For Exercises 1324, sketch the normal...Ch. 5.2 - IQ Scores. For Exercises 1324, sketch the normal...Ch. 5.2 - IQ Scores. For Exercises 1324, sketch the normal...Ch. 5.2 - IQ Scores. For Exercises 1324, sketch the normal...Ch. 5.2 - IQ Scores. For Exercises 1324, sketch the normal...Ch. 5.2 - IQ Scores. For Exercises 1324, sketch the normal...Ch. 5.2 - Prob. 20ECh. 5.2 - Prob. 21ECh. 5.2 - Prob. 22ECh. 5.2 - Prob. 23ECh. 5.2 - IQ Scores. For Exercises 1324, sketch the normal...Ch. 5.2 - Heights of Males. For Exercises 2536, sketch the...Ch. 5.2 - Heights of Males. For Exercises 2536, sketch the...Ch. 5.2 - Heights of Males. For Exercises 2536, sketch the...Ch. 5.2 - Heights of Males. For Exercises 2536, sketch the...Ch. 5.2 - Heights of Males. For Exercises 2536, sketch the...Ch. 5.2 - Heights of Males. For Exercises 2536, sketch the...Ch. 5.2 - Heights of Males. For Exercises 2536, sketch the...Ch. 5.2 - Heights of Males. For Exercises 2536, sketch the...Ch. 5.2 - Heights of Males. For Exercises 2536, sketch the...Ch. 5.2 - Heights of Males. For Exercises 2536, sketch the...Ch. 5.2 - Heights of Males. For Exercises 2536, sketch the...Ch. 5.2 - Heights of Males. For Exercises 2536, sketch the...Ch. 5.2 - Coin Weights. Consider the following table,...Ch. 5.2 - Pregnancy Lengths. Lengths of pregnancies are...Ch. 5.2 - SAT Scores. Based on data from the College Board,...Ch. 5.2 - GRE Scores. Assume that the scores on the Graduate...Ch. 5.2 - Body Temperatures. Assume that body temperatures...Ch. 5.2 - Spelling Bee Scores. At the district spelling bee,...Ch. 5.2 - Being a Marine. Heights of adult American males...Ch. 5.2 - Prob. 44ECh. 5.3 - Distribution of Means. What is a distribution of...Ch. 5.3 - Notation. This section includes formulas using the...Ch. 5.3 - Central Limit Theorem. What is the Central Limit...Ch. 5.3 - Central Limit Theorem. Briefly explain a major...Ch. 5.3 - Prob. 5ECh. 5.3 - Does It Make Sense? For Exercises 58, determine...Ch. 5.3 - Does It Make Sense? For Exercises 58, determine...Ch. 5.3 - Prob. 8ECh. 5.3 - Prob. 9ECh. 5.3 - Weights. Weights of adult males are normally...Ch. 5.3 - Twelve-Sided Dice and the Central Limit Theorem....Ch. 5.3 - Ten-Sided Dice and the Central Limit Theorem....Ch. 5.3 - Weights. In Exercises 1316, assume that weights of...Ch. 5.3 - Weights. In Exercises 1316, assume that weights of...Ch. 5.3 - Weights. In Exercises 1316, assume that weights of...Ch. 5.3 - Weights. In Exercises 1316, assume that weights of...Ch. 5.3 - Amounts of Cola. Assume that cans of cola are...Ch. 5.3 - Designing Strobe Lights. An aircraft strobe light...Ch. 5.3 - Designing Motorcycle Helmets. Engineers must...Ch. 5.3 - Redesign of Ejection Seats. When women first...Ch. 5.3 - Prob. 21ECh. 5.3 - Vending Machines. Currently, quarters have weights...Ch. 5.3 - Aircraft Safety Standards. Federal Aviation...Ch. 5.3 - Prob. 24ECh. 5 - For each of the following situations, state...Ch. 5 - Women have head circumferences that are normally...Ch. 5 - Assume that body temperatures of healthy adults...Ch. 5 - Which of the following statements are correct? a....Ch. 5 - Which of the following is likely to have a...Ch. 5 - Pulse Rates. In Exercises 310, assume that pulse...Ch. 5 - Pulse Rates. In Exercises 310, assume that pulse...Ch. 5 - Pulse Rates. In Exercises 310, assume that pulse...Ch. 5 - Pulse Rates. In Exercises 310, assume that pulse...Ch. 5 - Pulse Rates. In Exercises 310, assume that pulse...Ch. 5 - Pulse Rates. In Exercises 310, assume that pulse...Ch. 5 - Pulse Rates. In Exercises 310, assume that pulse...Ch. 5 - Pulse Rates. In Exercises 310, assume that pulse...
Knowledge Booster


Learn more about
Need a deep-dive on the concept behind this application? Look no further. Learn more about this topic, statistics and related others by exploring similar questions and additional content below.Similar questions
- Suppose a random sample of 459 married couples found that 307 had two or more personality preferences in common. In another random sample of 471 married couples, it was found that only 31 had no preferences in common. Let p1 be the population proportion of all married couples who have two or more personality preferences in common. Let p2 be the population proportion of all married couples who have no personality preferences in common. Find a95% confidence interval for . Round your answer to three decimal places.arrow_forwardA history teacher interviewed a random sample of 80 students about their preferences in learning activities outside of school and whether they are considering watching a historical movie at the cinema. 69 answered that they would like to go to the cinema. Let p represent the proportion of students who want to watch a historical movie. Determine the maximal margin of error. Use α = 0.05. Round your answer to three decimal places. arrow_forwardA random sample of medical files is used to estimate the proportion p of all people who have blood type B. If you have no preliminary estimate for p, how many medical files should you include in a random sample in order to be 99% sure that the point estimate will be within a distance of 0.07 from p? Round your answer to the next higher whole number.arrow_forward
- A clinical study is designed to assess the average length of hospital stay of patients who underwent surgery. A preliminary study of a random sample of 70 surgery patients’ records showed that the standard deviation of the lengths of stay of all surgery patients is 7.5 days. How large should a sample to estimate the desired mean to within 1 day at 95% confidence? Round your answer to the whole number.arrow_forwardA clinical study is designed to assess the average length of hospital stay of patients who underwent surgery. A preliminary study of a random sample of 70 surgery patients’ records showed that the standard deviation of the lengths of stay of all surgery patients is 7.5 days. How large should a sample to estimate the desired mean to within 1 day at 95% confidence? Round your answer to the whole number.arrow_forwardIn the experiment a sample of subjects is drawn of people who have an elbow surgery. Each of the people included in the sample was interviewed about their health status and measurements were taken before and after surgery. Are the measurements before and after the operation independent or dependent samples?arrow_forward
- iid 1. The CLT provides an approximate sampling distribution for the arithmetic average Ỹ of a random sample Y₁, . . ., Yn f(y). The parameters of the approximate sampling distribution depend on the mean and variance of the underlying random variables (i.e., the population mean and variance). The approximation can be written to emphasize this, using the expec- tation and variance of one of the random variables in the sample instead of the parameters μ, 02: YNEY, · (1 (EY,, varyi n For the following population distributions f, write the approximate distribution of the sample mean. (a) Exponential with rate ẞ: f(y) = ß exp{−ßy} 1 (b) Chi-square with degrees of freedom: f(y) = ( 4 ) 2 y = exp { — ½/ } г( (c) Poisson with rate λ: P(Y = y) = exp(-\} > y! y²arrow_forward2. Let Y₁,……., Y be a random sample with common mean μ and common variance σ². Use the CLT to write an expression approximating the CDF P(Ỹ ≤ x) in terms of µ, σ² and n, and the standard normal CDF Fz(·).arrow_forwardmatharrow_forward
- Compute the median of the following data. 32, 41, 36, 42, 29, 30, 40, 22, 25, 37arrow_forwardTask Description: Read the following case study and answer the questions that follow. Ella is a 9-year-old third-grade student in an inclusive classroom. She has been diagnosed with Emotional and Behavioural Disorder (EBD). She has been struggling academically and socially due to challenges related to self-regulation, impulsivity, and emotional outbursts. Ella's behaviour includes frequent tantrums, defiance toward authority figures, and difficulty forming positive relationships with peers. Despite her challenges, Ella shows an interest in art and creative activities and demonstrates strong verbal skills when calm. Describe 2 strategies that could be implemented that could help Ella regulate her emotions in class (4 marks) Explain 2 strategies that could improve Ella’s social skills (4 marks) Identify 2 accommodations that could be implemented to support Ella academic progress and provide a rationale for your recommendation.(6 marks) Provide a detailed explanation of 2 ways…arrow_forwardQuestion 2: When John started his first job, his first end-of-year salary was $82,500. In the following years, he received salary raises as shown in the following table. Fill the Table: Fill the following table showing his end-of-year salary for each year. I have already provided the end-of-year salaries for the first three years. Calculate the end-of-year salaries for the remaining years using Excel. (If you Excel answer for the top 3 cells is not the same as the one in the following table, your formula / approach is incorrect) (2 points) Geometric Mean of Salary Raises: Calculate the geometric mean of the salary raises using the percentage figures provided in the second column named “% Raise”. (The geometric mean for this calculation should be nearly identical to the arithmetic mean. If your answer deviates significantly from the mean, it's likely incorrect. 2 points) Starting salary % Raise Raise Salary after raise 75000 10% 7500 82500 82500 4% 3300…arrow_forward
arrow_back_ios
SEE MORE QUESTIONS
arrow_forward_ios
Recommended textbooks for you
 Big Ideas Math A Bridge To Success Algebra 1: Stu...AlgebraISBN:9781680331141Author:HOUGHTON MIFFLIN HARCOURTPublisher:Houghton Mifflin Harcourt
 Glencoe Algebra 1, Student Edition, 9780079039897...AlgebraISBN:9780079039897Author:CarterPublisher:McGraw Hill
 Holt Mcdougal Larson Pre-algebra: Student Edition...AlgebraISBN:9780547587776Author:HOLT MCDOUGALPublisher:HOLT MCDOUGAL
 Algebra: Structure And Method, Book 1AlgebraISBN:9780395977224Author:Richard G. Brown, Mary P. Dolciani, Robert H. Sorgenfrey, William L. ColePublisher:McDougal Littell
Big Ideas Math A Bridge To Success Algebra 1: Stu...
Algebra
ISBN:9781680331141
Author:HOUGHTON MIFFLIN HARCOURT
Publisher:Houghton Mifflin Harcourt
Glencoe Algebra 1, Student Edition, 9780079039897...
Algebra
ISBN:9780079039897
Author:Carter
Publisher:McGraw Hill
Holt Mcdougal Larson Pre-algebra: Student Edition...
Algebra
ISBN:9780547587776
Author:HOLT MCDOUGAL
Publisher:HOLT MCDOUGAL
Algebra: Structure And Method, Book 1
Algebra
ISBN:9780395977224
Author:Richard G. Brown, Mary P. Dolciani, Robert H. Sorgenfrey, William L. Cole
Publisher:McDougal Littell
Continuous Probability Distributions - Basic Introduction; Author: The Organic Chemistry Tutor;https://www.youtube.com/watch?v=QxqxdQ_g2uw;License: Standard YouTube License, CC-BY
Probability Density Function (p.d.f.) Finding k (Part 1) | ExamSolutions; Author: ExamSolutions;https://www.youtube.com/watch?v=RsuS2ehsTDM;License: Standard YouTube License, CC-BY
Find the value of k so that the Function is a Probability Density Function; Author: The Math Sorcerer;https://www.youtube.com/watch?v=QqoCZWrVnbA;License: Standard Youtube License