Concept explainers
Videos
To review:
The changes in the gut microbiome of bears during winters and summers.
Given:
The brown bears (Ursus arctos) were taken by the researchers for studying the role of gut microbiota in the digestion of food and in many other aspects of nutrition. Brown bears undergo hibernation when the environment is extreme cold. They analyzed whether the microbiome of the bear’s gut was different before and after fasting. They studied the blood and the fecal samples from 16 free-ranging brown bears during hibernation (February or March) and following hibernation (June). There was presence of different microbe communities in different amounts during different seasons and same was with triglycerides and other nutrients.
The following graphs were plotted after observing the conditions in winters and summers. Graph 1 shows the presence of different composition of the microbiome during different seasons. Also, the differences in the blood levels of triglycerides, lactate, and succinate are depicted.
The effects of the microbiota were also examined after introducing them into germ-free mice. Germ-free mice, unlike normal mice are devoid of gut microbiota and are unable to gain mass when they are kept on a high-fat diet. Fecal transplants from summer and the winter bears were given to the germ-free mice. Graph 2 shows the changes in body mass, fat content, and blood triglyceride levels of the mice after two weeks.
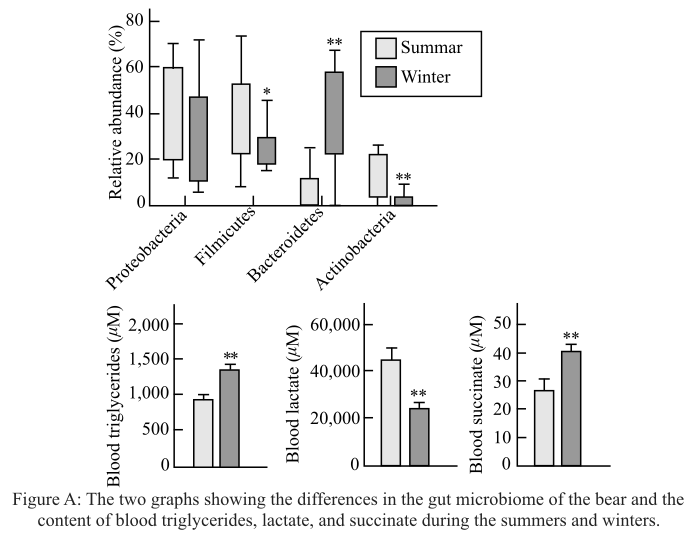
Graph 1: The two graphs showing the differences in the gut microbiome of the bear and the content of blood triglycerides, lactate, and succinate during the summers and winters.
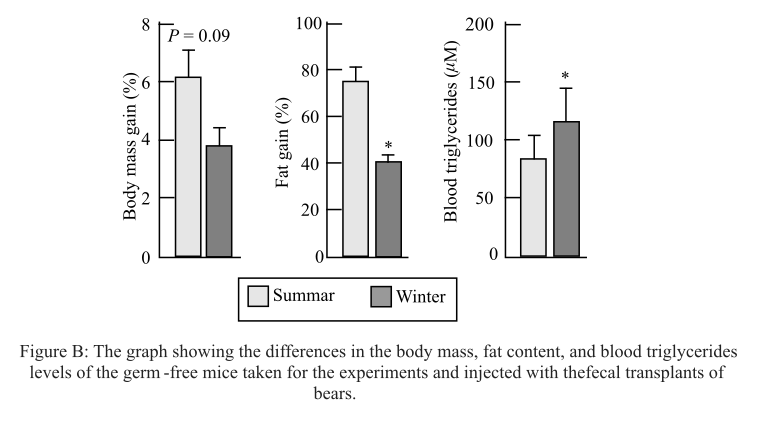
Graph 2: The graph showing the differences in the body mass, fat content, and blood triglycerides level of the germ-free mice taken for the experiments and injected with the fecal transplants of bears.
Introduction:
There are a number of microbes present in the gut of bears. They help in digestion of the food. The more the amount of a particular microbe, the more will be the digestion by that microbe. There is a difference in the amounts of the different microbes in the gut during summers and winters in order to digest different products in the gut.
Want to see the full answer?
Check out a sample textbook solution
Chapter 50 Solutions
EBK LIFE: THE SCIENCE OF BIOLOGY


- With reference to their absorption spectra of the oxy haemoglobin intact line) and deoxyhemoglobin (broken line) shown in Figure 2 below, how would you best explain the reason why there are differences in the major peaks of the spectra? Figure 2. SPECTRA OF OXYGENATED AND DEOXYGENATED HAEMOGLOBIN OBTAINED WITH THE RECORDING SPECTROPHOTOMETER 1.4 Abs < 0.8 06 0.4 400 420 440 460 480 500 520 540 560 580 600 nm 1. The difference in the spectra is due to a pH change in the deoxy-haemoglobin due to uptake of CO2- 2. There is more oxygen-carrying plasma in the oxy-haemoglobin sample. 3. The change in Mr due to oxygen binding causes the oxy haemoglobin to have a higher absorbance peak. 4. Oxy-haemoglobin is contaminated by carbaminohemoglobin, and therefore has a higher absorbance peak 5. Oxy-haemoglobin absorbs more light of blue wavelengths and less of red wavelengths than deoxy-haemoglobinarrow_forwardWith reference to their absorption spectra of the oxy haemoglobin intact line) and deoxyhemoglobin (broken line) shown in Figure 2 below, how would you best explain the reason why there are differences in the major peaks of the spectra? Figure 2. SPECTRA OF OXYGENATED AND DEOXYGENATED HAEMOGLOBIN OBTAINED WITH THE RECORDING SPECTROPHOTOMETER 1.4 Abs < 0.8 06 0.4 400 420 440 460 480 500 520 540 560 580 600 nm 1. The difference in the spectra is due to a pH change in the deoxy-haemoglobin due to uptake of CO2- 2. There is more oxygen-carrying plasma in the oxy-haemoglobin sample. 3. The change in Mr due to oxygen binding causes the oxy haemoglobin to have a higher absorbance peak. 4. Oxy-haemoglobin is contaminated by carbaminohemoglobin, and therefore has a higher absorbance peak 5. Oxy-haemoglobin absorbs more light of blue wavelengths and less of red wavelengths than deoxy-haemoglobinarrow_forwardWhich ONE of the following is FALSE regarding haemoglobin? It has two alpha subunits and two beta subunits. The subunits are joined by disulphide bonds. Each subunit covalently binds a haem group. Conformational change in one subunit can be transmitted to another. There are many variant ("mutant") forms of haemoglobin that are not harmful.arrow_forward
- Which ONE of the following is FALSE regarding haemoglobin? It has two alpha subunits and two beta subunits. The subunits are joined by disulphide bonds. Each subunit covalently binds a haem group. Conformational change in one subunit can be transmitted to another. There are many variant ("mutant") forms of haemoglobin that are not harmful.arrow_forwardDuring a routine medical check up of a healthy man it was found that his haematocrit value was highly unusual – value of 60%. What one of the options below is the most likely reason? He will have a diet high in iron. He is likely to be suffering from anaemia. He lives at high altitude. He has recently recovered from an accident where he lost a lot of blood. He has a very large body size.arrow_forwardExplain what age of culture is most likely to produce an endospore?arrow_forward
- Explain why hot temperatures greater than 45 degrees celsius would not initiate the sporulation process in endospores?arrow_forwardEndospore stain: Consider tube 2 of the 7-day bacillus culture. After is was heated, it was incubated for 24 hours then refrigerated. Do you think the cloudiness in this tube is due mostly to vegetative cells or to endospores? Explain your reasoningarrow_forwardReactunts C6H12O6 (Glucose) + 2NAD+ + 2ADP 2 Pyruvic acid + 2NADH + 2ATP a. Which of the above are the reactants? b. Which of the above are the products? c. Which reactant is the electron donor? GHz 06 (glucose) d. Which reactant is the electron acceptor? NAD e. Which of the products have been reduced? NADH f. Which of the products have been oxidized? g. Which process was used to produce the ATP? h. Where was the energy initially in this chemical reaction and where is it now that it is finished? i. Where was the carbon initially in this chemical reaction and where is it now that it is finished? j. Where were the electrons initially in this chemical reaction and where is it now that it is finished? 3arrow_forward
- There is ________ the concept of global warming. Very strong evidence to support Some strong evidence to support Evidence both supporting and against Evidence againstarrow_forwardHow many types of reactions can an enzyme perform?arrow_forwardYour goal is to produce black seeds resistant to mold. So you make the same cross again (between a homozygous black seeded, mold susceptible parent and a homozygous white seeded and mold resistant parent), and, again, advance progeny by SSD to create 100 F10 generation plants. Based on the information you obtained from your first crossing experiment (Question #4), how many F10 plants would you expect to have black seeds and be resistant to mold? Assume that a toxin produced by the mold fungus has been isolated. Only mold resistant seeds will germinate in the presence of the toxin. Could you use this toxin screening procedure to have segregation distortion work in your favor in the F2 generation? Explain your answer. Info from Question 4 a. P Locus (Seed Color): Hypothesis: The null hypothesis (H₀) is that seed color is controlled by alleles at a single locus. Observed Data: Total white seeds: 45 (resistant plants) + 6 (susceptible plants) = 51 Total black seeds: 7 (resistant…arrow_forward
 Biology (MindTap Course List)BiologyISBN:9781337392938Author:Eldra Solomon, Charles Martin, Diana W. Martin, Linda R. BergPublisher:Cengage Learning
 Health Safety And Nutrition F/Young ChildHealth & NutritionISBN:9781305144767Author:MAROTZPublisher:Cengage
 Biology: The Dynamic Science (MindTap Course List)BiologyISBN:9781305389892Author:Peter J. Russell, Paul E. Hertz, Beverly McMillanPublisher:Cengage Learning
 Biology 2eBiologyISBN:9781947172517Author:Matthew Douglas, Jung Choi, Mary Ann ClarkPublisher:OpenStax