Concept explainers
Videos
Contribution margin, break-even sales, cost-volume-profit chart, margin of safety, and operating leverage
Wolsey Industries Inc. expects to maintain the same inventories at the end of 20Y3 as at the beginning of the year. The total of all production costs for the year is therefore assumed to be equal to the cost of goods sold. With this in mind, the various department heads were asked to submit estimates of the costs for their departments during the year. A summary report of these estimates is as follows:

It is expected that 21,875 units will be sold at a price of $160 a unit. Maximum sales within the relevant range are 27,000 units.
Instructions
Prepare an estimated income statement for 20Y3.
What is the expected contribution margin ratio?
Determine the break-even sales in units and dollars.
Construct a cost-volume-profit chart indicating the break-even sales.
What is the expected margin of safety in dollars and as a percentage of sales?
Determine the operating leverage.
It is expected that 12,000 units will be sold a price of $240 a unit. Maximum sales within the relevant range are 18,000 units.
Instructions
Prepare an estimated income statement for 20Y7.
What is the expected contribution margin ratio?
Determine the break-even sales in units and dollars.
Construct a cost-volume-profit chart indicating the break-even sales.
What is the expected margin of safety in dollars and as a percentage of sales?
Determine the operating leverage.
1.
Prepare an estimated income statement for 20Y8.
Explanation of Solution
Cost-Volume-Profit Analysis: It is a method followed to analyze the relationship between the sales, costs, and the related profit or loss at various levels of units sold. In other words, it shows the effect of the changes in the cost and the sales volume on the operating income of the company.
Prepare an estimated income statement for 20Y8.
| W Incorporation | |||
| Estimated Income Statement | |||
| For the year ended December 31, 20Y8 | |||
| Particulars | Amount ($) | Amount ($) | Amount ($) |
| Sales (1) | 3,500,000 | ||
| Less: Cost of Goods sold: | |||
| Direct Materials (2) | 1,006,250 | ||
| Direct Labor (3) | 875,000 | ||
| Factory Overhead (4) | 637,500 | ||
| Cost of Goods Sold | (2,518,750) | ||
| Gross Profit | 981,250 | ||
| Less: Expenses: | |||
| Selling expenses: | |||
| Sales salaries and commissions (5) | 285,000 | ||
| Advertising | 40,000 | ||
| Travel | 12,000 | ||
| Miscellaneous selling expense (6) | 29,475 | ||
| Total selling expenses | 366,475 | ||
| Administrative expenses: | |||
| Office and Officers’ salaries | 132,000 | ||
| Supplies (7) | 97,500 | ||
| Miscellaneous administrative expenses (8) | 35,275 | ||
| Total administrative expenses | 264,775 | ||
| Total expenses | (631,250) | ||
| Income from operations | 350,000 | ||
Table (1)
Working note (1):
Determine sales.
Number of units to be sold =21,875 units
Selling price per unit =$160 per unit
Working note (2):
Determine the cost of direct materials.
Number of units to be sold =21,875 units
Direct Materials cost per unit =$46 per unit
Working note (3):
Determine the cost of direct labor.
Number of units to be sold =21,875 units
Direct labor cost per unit =$40 per unit
Working note (4):
Determine the cost of factory overhead.
Factory overhead-Fixed =$200,000
Number of units to be sold =21,875 units
Factory overhead-Variable cost per unit =$20 per unit
Working note (5):
Determine the sales salaries and commissions.
Sales salaries and commissions-Fixed =$110,000
Number of units to be sold =21,875 units
Sales salaries and commissions-Variable cost per unit =$8 per unit
Working note (6):
Determine the miscellaneous selling expense.
Miscellaneous selling expense-Fixed =$7,600
Number of units to be sold =21,875 units
Miscellaneous selling expense-Variable cost per unit =$1 per unit
Working note (7):
Determine the supplies.
Supplies-Fixed =$10,000
Number of units to be sold =21,875 units
Supplies-Variable cost per unit =$4 per unit
Working note (8):
Determine the miscellaneous administrative expense.
Miscellaneous administrative expense-Fixed =$13,400
Number of units to be sold =21,875 units
Miscellaneous administrative expense-Variable cost per unit =$1 per unit
2.
Calculate the expected contribution margin ratio.
Explanation of Solution
Determine the expected contribution margin ratio.
Sales =$3,500,000 (1)
Variable cost =$2,625,000 (9)
Working note (9):
Determine the variable cost.
Number of units to be sold =21,875 units
Variable cost per unit =$120 per unit
Therefore, the expected contribution margin ratio is 25%.
3.
Calculate the break-even sales in units and dollars.
Explanation of Solution
Determine the break-even sales in units.
Fixed cost =$525,000
Contribution margin per unit =$40 per unit (10)
Working note (10):
Compute the contribution margin per unit.
Selling price per unit =$160 per unit
Variable cost per unit =$120 per unit
Determine the break-even sales in dollars.
Fixed cost =$525,000
Contribution margin ratio =25% (refer Part 2)
Therefore, the break-even sales in units is 13,125 units and dollars is $2,100,000.
4.
Construct a cost-volume-profit chart indicating the break-even sales.
Explanation of Solution
Construct a cost-volume-profit chart indicating the break-even sales.
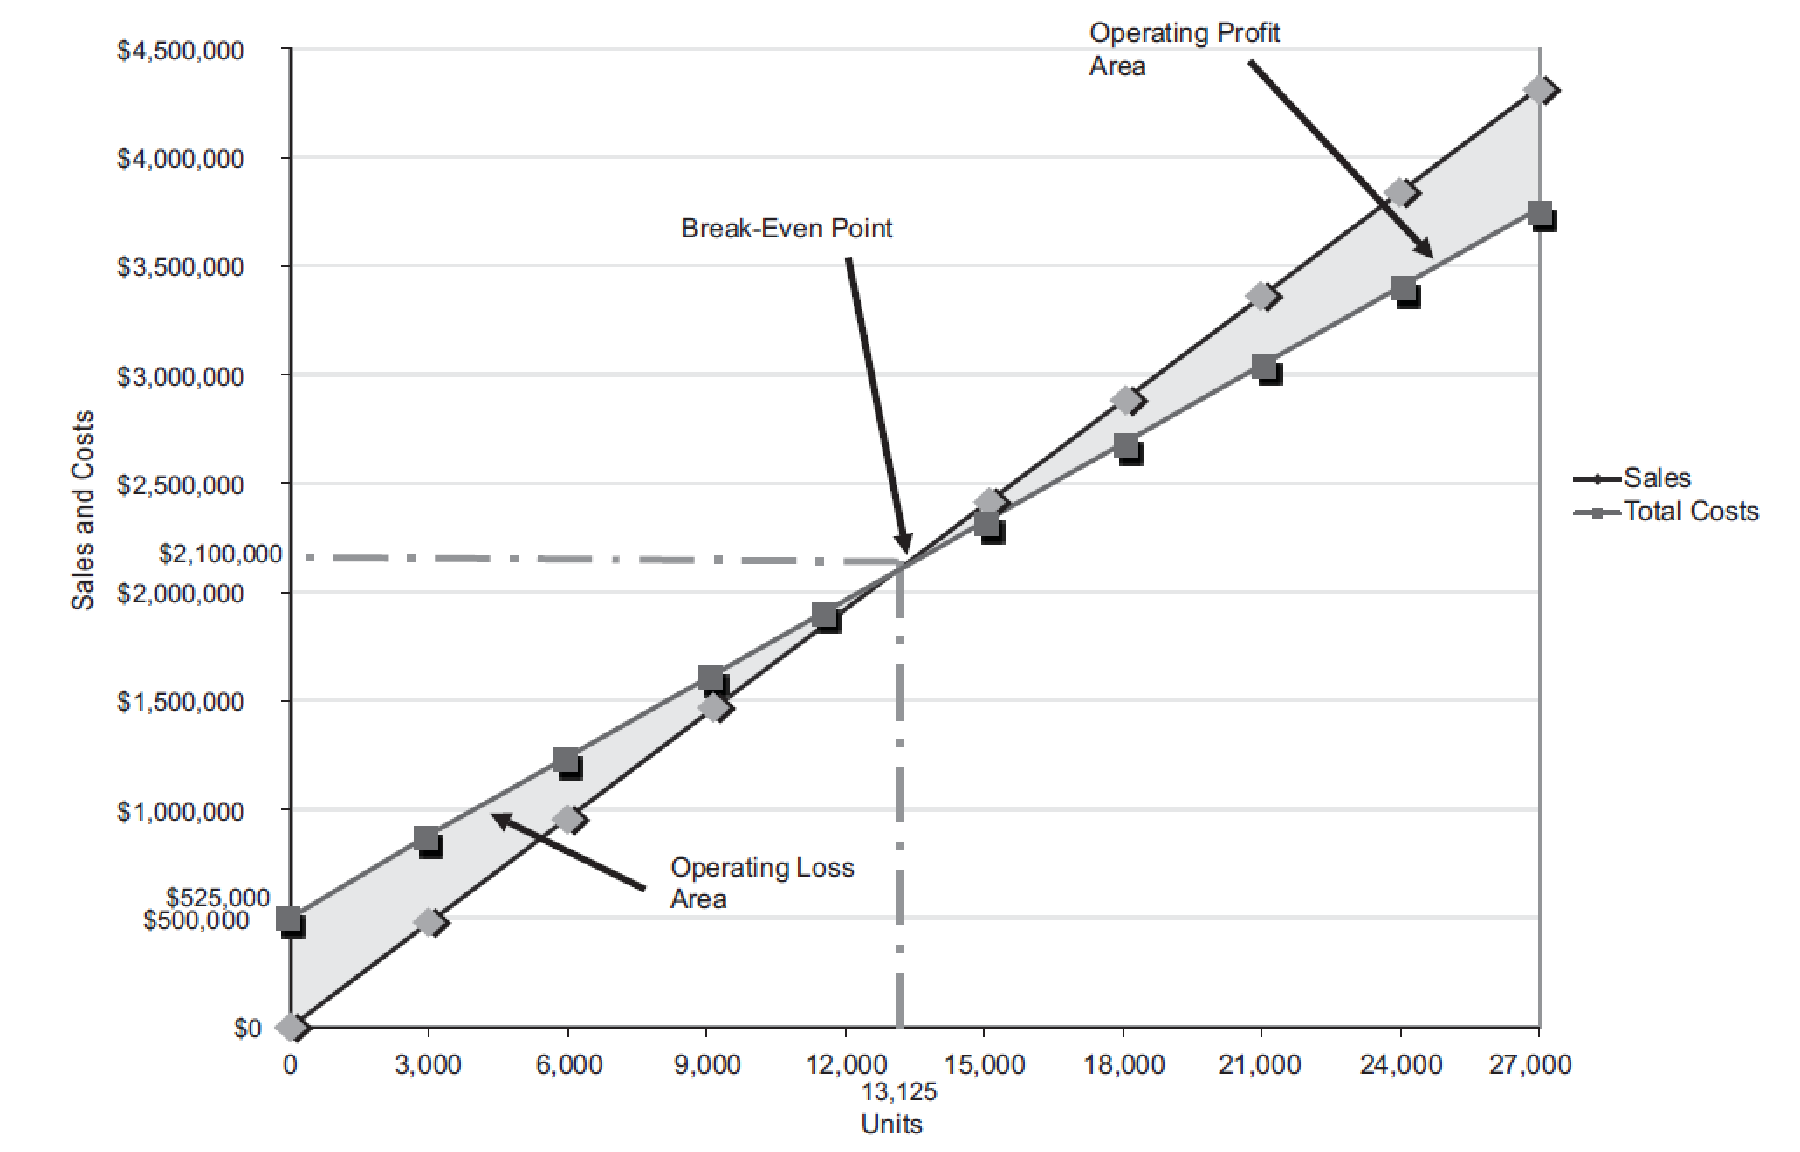
Figure (1)
The volume in units of sales is shown on the horizontal axis. The maximum relevant range is 27,000 units. The sales and the total costs (fixed cost and variable cost) in dollars is shown on the vertical axis. The maximum relevant range of sales and total costs is $4,500,000.
The total sales line is drawn right upward by connecting the first point at $0 to the second point at $4,320,000
The total cost line is drawn right upward by connecting the first point at $525,000 (fixed cost) on the vertical axis to the second point at
The break-even point is the intersection point where the total sales line and total cost line meet. The vertical dotted line drawn downward from the intersection point reaches at 13,125 units. It indicates the break-even sales (units). The horizontal line drawn to the left towards the vertical axis reaches at $2,100,000. It indicates the break-even sales (dollars). Refer Part 3 for the break-even values.
The operating profit area is the area where the total sales line exceeds the total cost line. However, the operating loss area is the area where the total cost exceeds the total sales line.
5.
Calculate the expected margin of safety in dollars and as a percentage of sales.
Explanation of Solution
Determine the expected margin of safety in dollars.
Sales =$3,500,000 (1)
Sales at break-even point =$2,100,000 (refer Part 3)
Determine the expected margin of safety as a percentage of sales.
Sales =$3,500,000 (1)
Margin of Safety in dollars =$1,400,000
Therefore, the expected margin of safety in dollars is $1,400,000 and as a percentage of sales is 40%.
6.
Calculate the operating leverage.
Explanation of Solution
Determine the operating leverage.
Contribution margin =$875,000 (11)
Income from operations =$350,000 (refer Table 1)
Working note (11):
Determine the contribution margin
Sales =$3,500,000 (1)
Variable cost =$2,625,000 (9)
Therefore, the operating leverage is 2.5
Want to see more full solutions like this?
Chapter 5 Solutions
Bundle: Managerial Accounting, Loose-leaf Version, 14th - Book Only


- Joe and Ethan each own 50% of JH Corporation, a calendar year taxpayer. Distributions from JH are: $750,000 to Joe on April 1 and $250,000 to Ethan on May 1. JH’s current E & P is $300,000 and its accumulated E & P is $600,000. How much of the accumulated E & P is allocated to Ethan’s distribution? a. $0b. $75,000c. $150,000d. $300,000e. None of the above b or c?arrow_forwardPlease provide the accurate answer to this general accounting problem using appropriate methods.arrow_forwardI need guidance with this general accounting problem using the right accounting principles.arrow_forward
- Please provide the accurate answer to this general accounting problem using appropriate methods.arrow_forwardPlease provide the correct answer to this general accounting problem using accurate calculations.arrow_forwardI am looking for the correct answer to this general accounting problem using valid accounting standards.arrow_forward
- SUBJECT = GENERAL ACCOUNTINGarrow_forwardI am looking for the correct answer to this general accounting question with appropriate explanations.arrow_forwardJH Corporation is a calendar year taxpayer formed in 2014 JH’s E & P before distributions for each of the past 5 years is listed below. 2018 $28,000 2017 $40,000 2016 $39,000 2015 $68,000 2014 $16,000 JH Corporation made the following distributions in the previous 5 years. 2017 Land (basis of $70,000, fair market value of $80,000) 2014 $20,000 cash JH’s accumulated E & P as of January 1, 2019 is: a. $91,000.b. $95,000.c. $101,000. d. $105,000.e. None of the above.arrow_forward
 Managerial AccountingAccountingISBN:9781337912020Author:Carl Warren, Ph.d. Cma William B. TaylerPublisher:South-Western College Pub
 Financial And Managerial AccountingAccountingISBN:9781337902663Author:WARREN, Carl S.Publisher:Cengage Learning,
 Managerial Accounting: The Cornerstone of Busines...AccountingISBN:9781337115773Author:Maryanne M. Mowen, Don R. Hansen, Dan L. HeitgerPublisher:Cengage Learning