
1.
Construct a cost-volume-profit chart indicating the break-even sales for last year, and verify the answer using the break-even equation.
1.
Explanation of Solution
Cost-Volume-Profit Analysis: It is a method followed to analyze the relationship between the sales, costs, and the related profit or loss at various levels of units sold. In other words, it shows the effect of the changes in the cost and the sales volume on the operating income of the company.
Construct a cost-volume-profit chart indicating the break-even sales for last year.
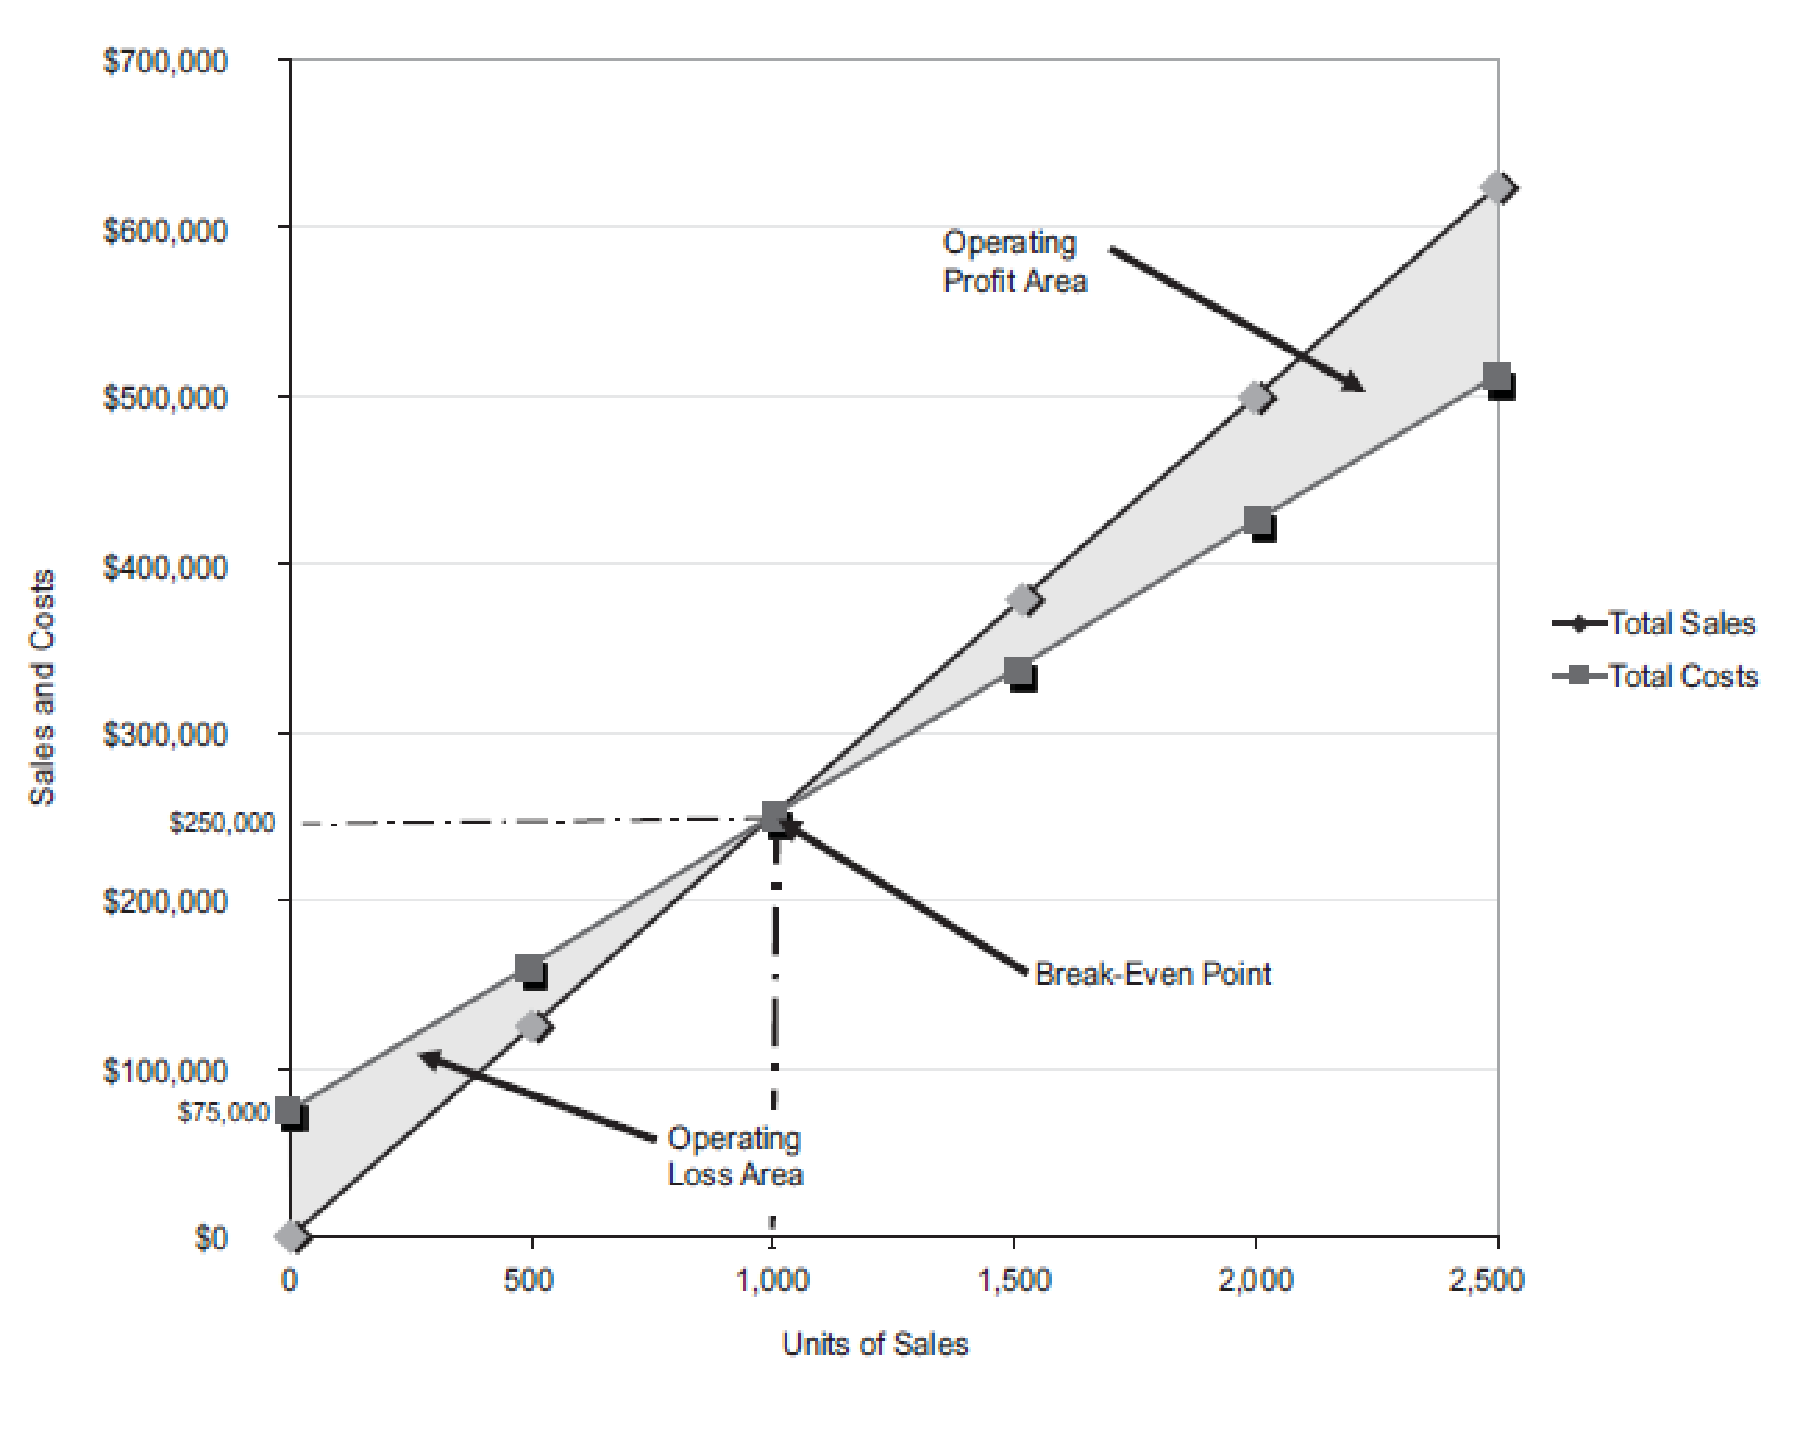
Figure (1)
The volume in units of sales is shown on the horizontal axis. The maximum relevant range is 2,500 units. The sales and the total costs (fixed cost and variable cost) in dollars is shown on the vertical axis. The maximum relevant range of sales and total costs is $700,000.
The total sales line is drawn right upward by connecting the first point at $0 to the second point at $625,000
The total cost line is drawn right upward by connecting the first point at $75,000 (fixed cost) on the vertical axis to the second point at $512,500
The break-even point is the intersection point where the total sales line and total cost line meet. The vertical dotted line drawn downward from the intersection point reaches at 1,000 units. It indicates the break-even sales (units). The horizontal line drawn to the left towards the vertical axis reaches at $250,000. It indicates the break-even sales (dollars).
The operating profit area is the area where the total sales line exceeds the total cost line. However, the operating loss area is the area where the total cost exceeds the total sales line.
Verify the answer using the break-even equation as follows:
Determine the break-even sales in units.
Fixed cost =$75,000
Contribution margin per unit =$75 per unit (1)
Determine the break-even sales in dollars.
Fixed cost =$75,000
Contribution margin ratio =30% (2)
Working note (1):
Compute the contribution margin per unit.
Selling price per unit =$250 per unit
Variable cost per unit =$175 per unit
Working note (2):
Determine the contribution margin ratio.
Contribution margin =$75 per unit (1)
Selling price per unit =$250 per unit
2(A)
Compute the income from operations for last year.
2(A)
Explanation of Solution
Compute the income from operations for last year as follows:
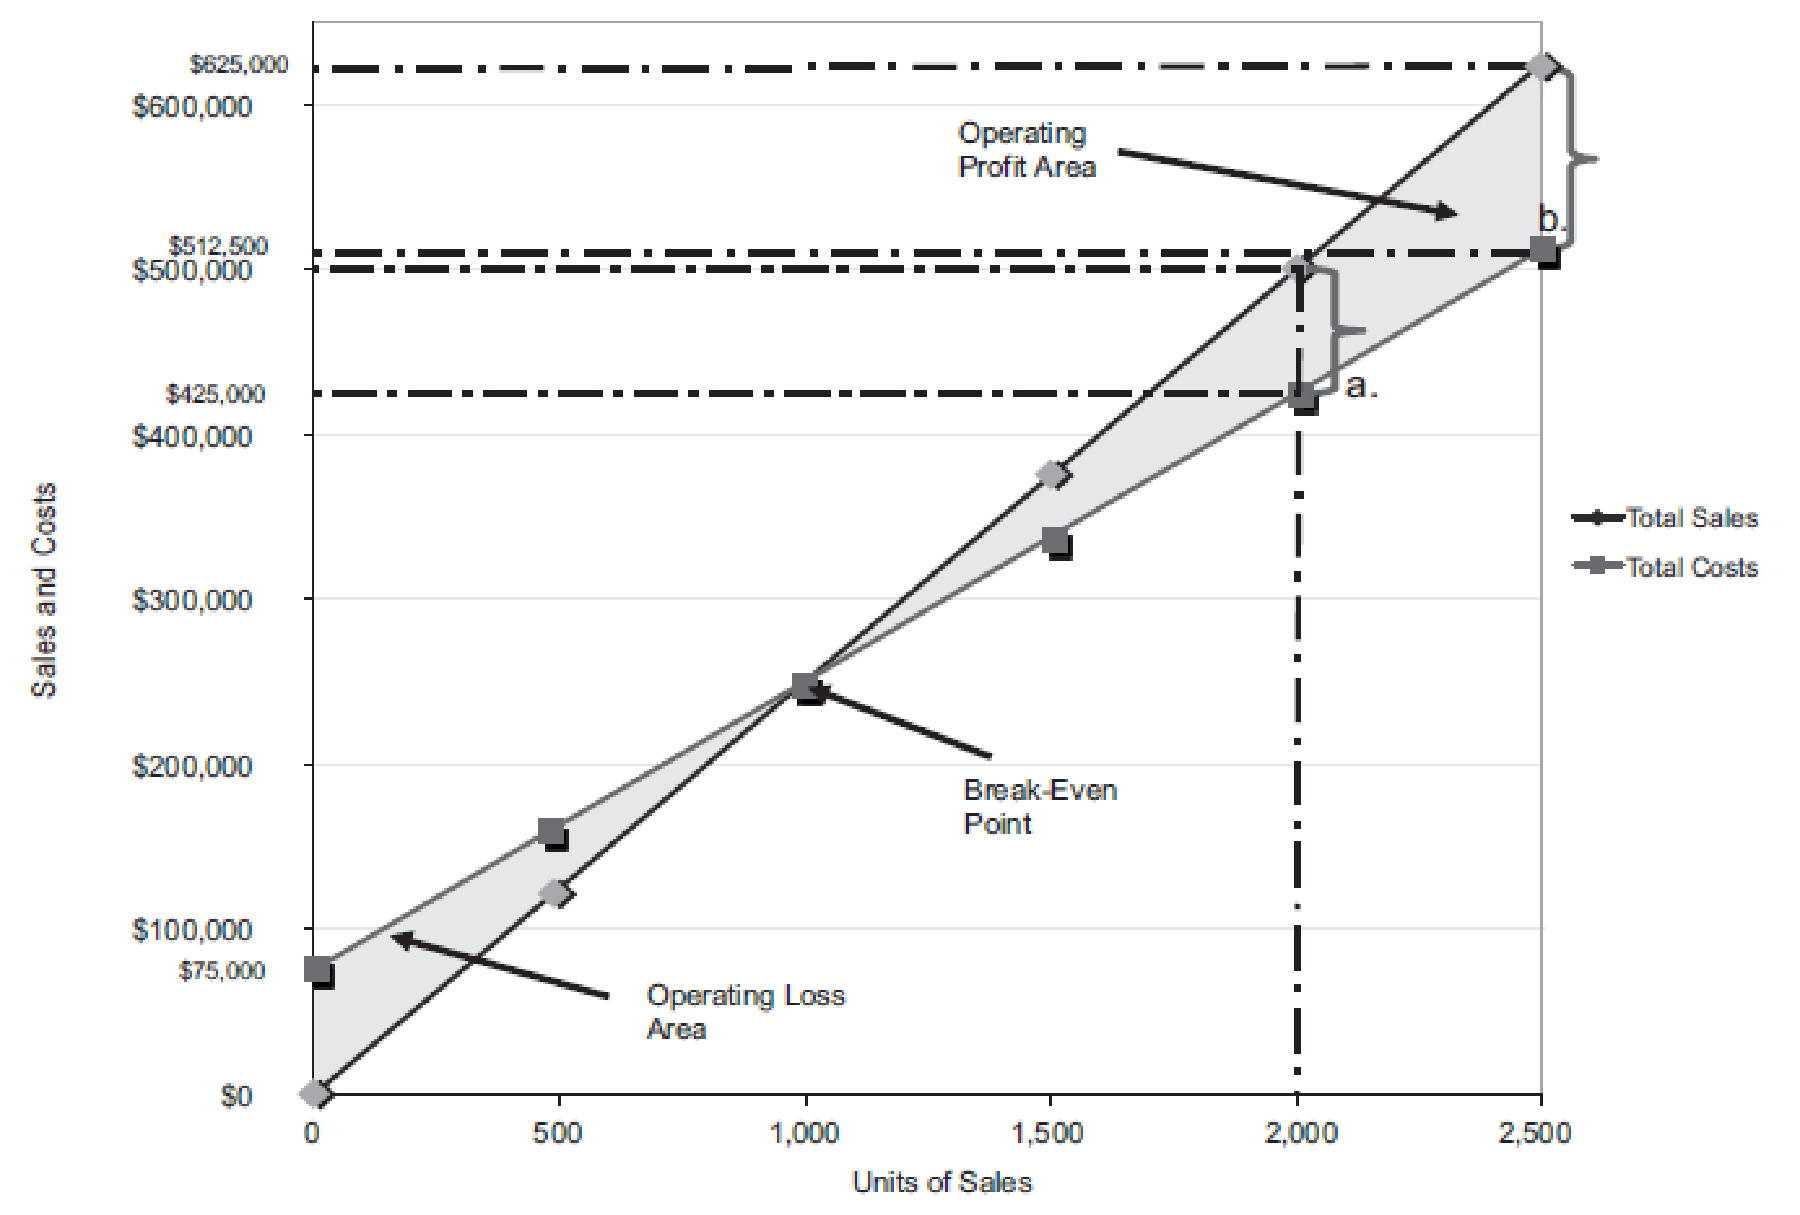
Figure (2)
Last year, the number of units sold is 2,000 units (3). The total sales is $500,000. The total cost is
Similarly, a dotted line is drawn from the total cost at $425,000 on the vertical axis towards the right and a dotted line is drawn upward for the 2,000 units sold from the horizontal axis. The two dotted line meet at a point which indicates the point of total cost at 2,000 units.
The dotted line from sales is above the dotted line for total cost. This indicates the income from operations. Thus, the area in between the two dotted lines is the income from operations of
Verify the answers using the mathematical approach to cost-volume-profit analysis.
Determine the income from operations for the last year.
| Determine the income from operations for 2,000 units | ||
| Particulars | Amount ($) | Amount ($) |
| Sales | 500,000 | |
| Less: Fixed costs | 75,000 | |
| Variable costs | 350,000 | (425,000) |
| Income from operations | 75,000 | |
Table (1)
Working note (3):
Determine the number of units sold.
Sales =$500,000
Selling price per unit =$250 per unit
2(B)
Compute the maximum income from operations realized during the year.
2(B)
Explanation of Solution
The maximum relevant range for number of units to be sold is 2,500 units. Thus, the total sale is
Similarly, a dotted line is drawn from the total cost at $512,500 on the vertical axis towards the right and a dotted line is drawn upward for the 2,500 units sold from the horizontal axis. The two dotted line meet at a point which indicates the point of total cost at 2,500 units.
The dotted line from sales is above the dotted line for total cost. This indicates the income from operations. Thus, the area in between the two dotted lines is the income from operations of
Determine the maximum income from operations that could have been realized during the year.
| Determine the income from operations for 2,500 units | ||
| Particulars | Amount ($) | Amount ($) |
| Sales | 625,000 | |
| Less: Fixed costs | 75,000 | |
| Variable costs | 437,500 | (512,500) |
| Income from operations | 112,500 | |
Table (2)
3.
Construct a cost-volume-profit chart indicating the break-even sales for the current year, and verify the answer using the break-even equation.
3.
Explanation of Solution
Construct a cost-volume-profit chart indicating the break-even sales for the current year as follows:
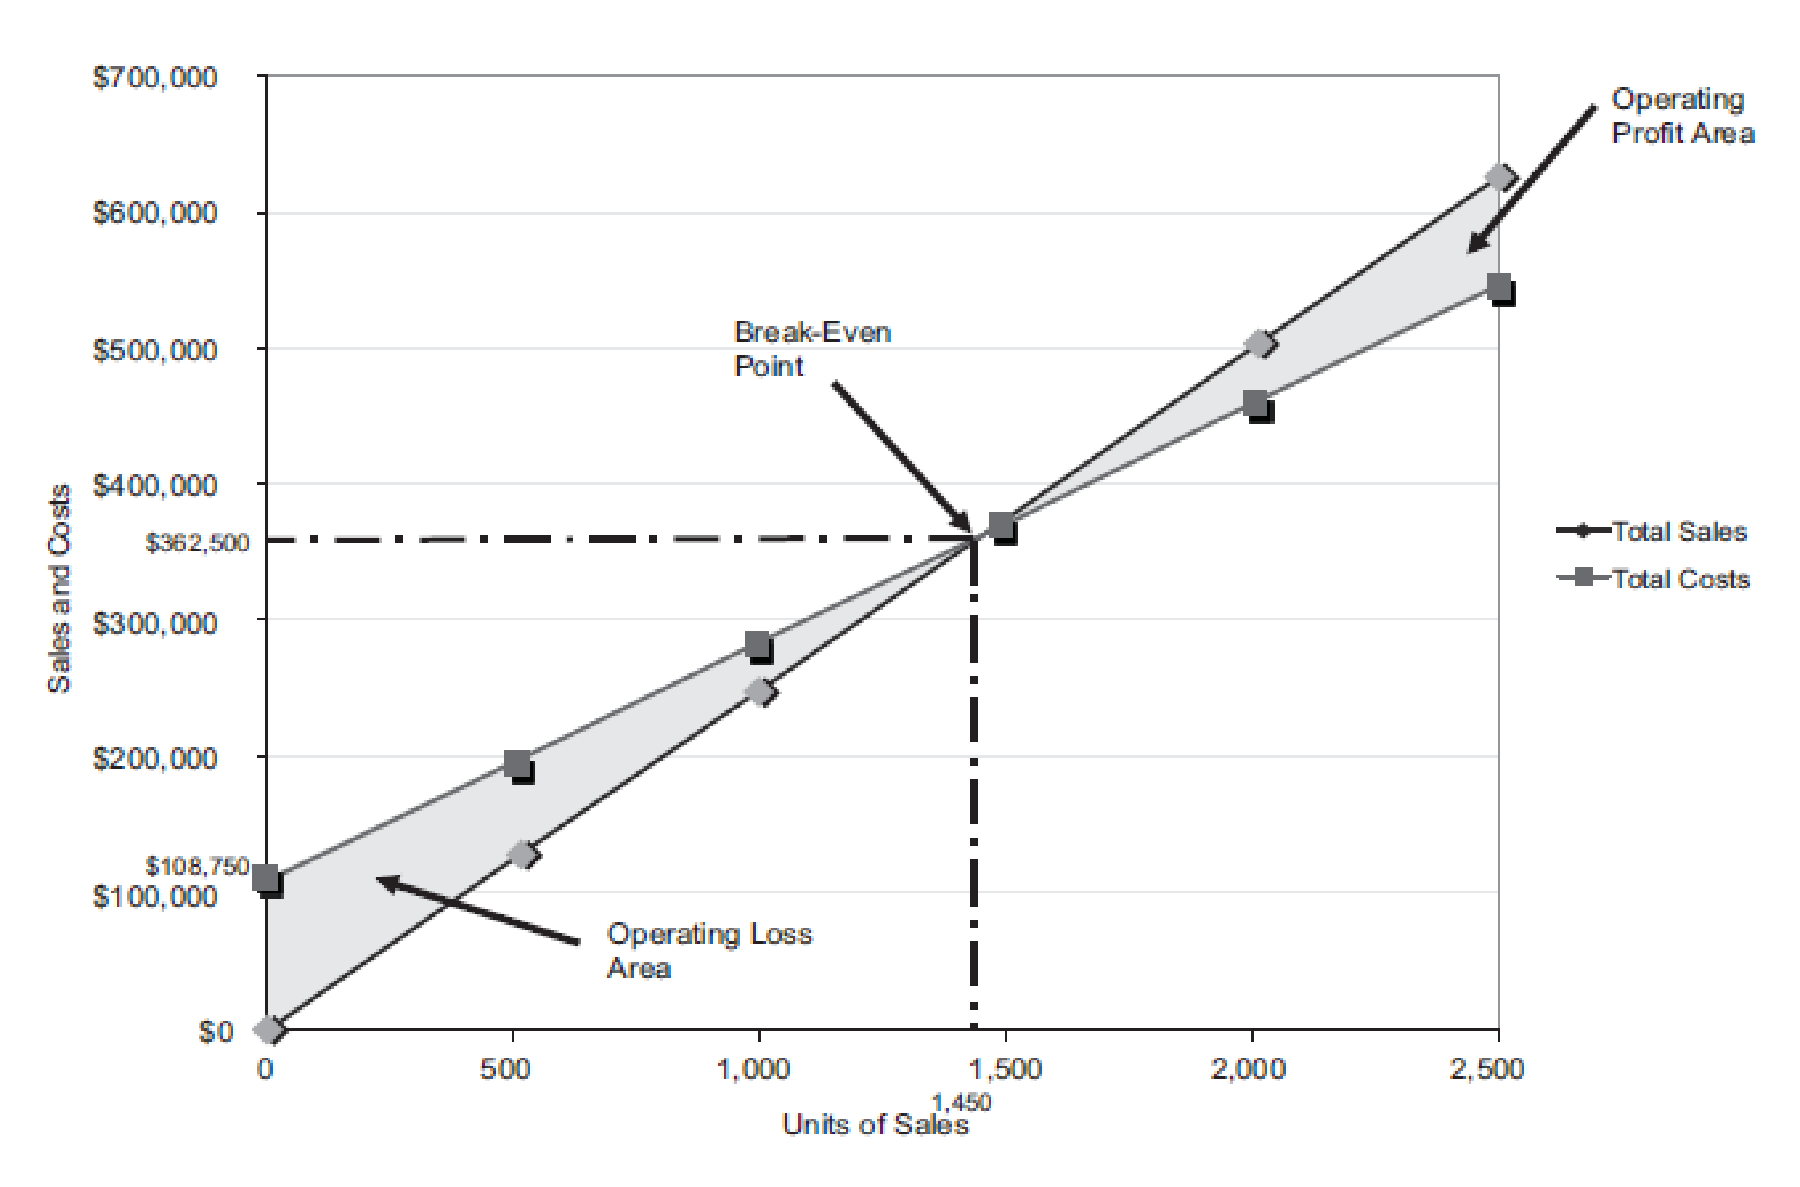
Figure (3)
The volume in units of sales is shown on the horizontal axis. The maximum relevant range is 2,500 units. The sales and the total costs (fixed cost and variable cost) in dollars is shown on the vertical axis. The maximum relevant range of sales and total costs is $700,000.
The total sales line is drawn right upward by connecting the first point at $0 to the second point at $625,000
The total cost line is drawn right upward by connecting the first point at
The break-even point is the intersection point where the total sales line and total cost line meet. The vertical dotted line drawn downward from the intersection point reaches at 1,450 units. It indicates the break-even sales (units). The horizontal line drawn to the left towards the vertical axis reaches at $362,500. It indicates the break-even sales (dollars).
The operating profit area is the area where the total sales line exceeds the total cost line. However, the operating loss area is the area where the total cost exceeds the total sales line.
Verify the answer using the break-even equation as follows:
Determine the break-even sales in units.
Fixed cost =$75,000
Increase in fixed cost (billboard advertising) =$33,750
Contribution margin per unit =$75 per unit (1)
Determine the break-even sales in dollars.
Fixed cost =$75,000
Increase in fixed cost (billboard advertising) =$33,750
Contribution margin ratio =30% (2)
4(A)
Compute the income from operations for sales 2,000 units, and verify the answers using the mathematical approach to cost-volume-profit analysis
4(A)
Explanation of Solution
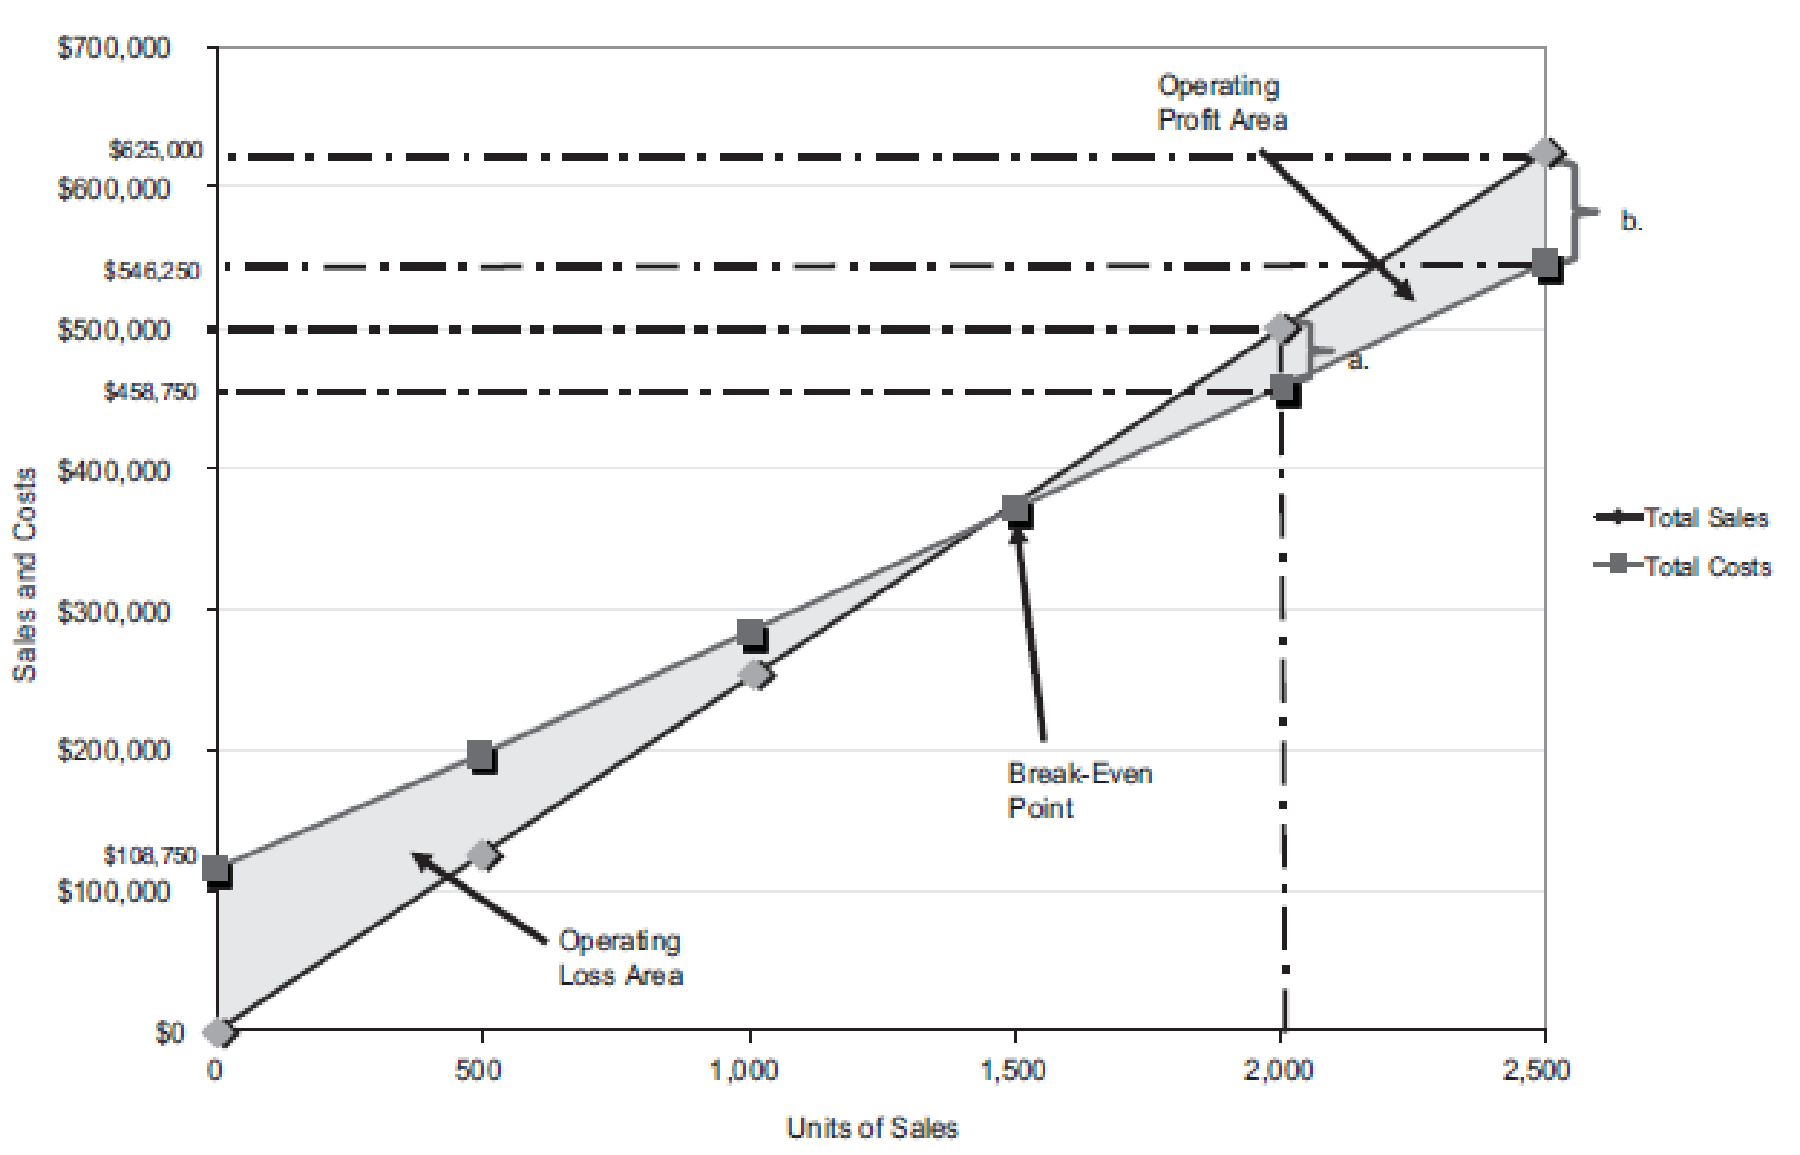
Figure (4)
Last year, the number of units sold is 2,000 units (3). The total sales is $500,000. The total cost is
Similarly, a dotted line is drawn from the total cost at $458,750 on the vertical axis towards the right and a dotted line is drawn upward for the 2,000 units sold from the horizontal axis. The two dotted line meet at a point which indicates the point of total cost at 2,000 units.
The dotted line from sales is above the dotted line for total cost. This indicates the income from operations. Thus, the area in between the two dotted lines is the income from operations of
Verify the answers using the mathematical approach to cost-volume-profit analysis.
Determine the income from operations for the last year.
| Determine the income from operations for 2,000 units | ||
| Particulars | Amount ($) | Amount ($) |
| Sales | 500,000 | |
| Less: Total Fixed costs | 108,750 | |
| Variable costs | 350,000 | (458,750) |
| Income from operations | 41,250 | |
Table (3)
4(B)
Compute the maximum income from operations that could have been realized during the year and verify the answer.
4(B)
Explanation of Solution
The maximum relevant range for number of units to be sold is 2,500 units. Thus, the total sales is
Similarly, a dotted line is drawn from the total cost at $546,250 on the vertical axis towards the right and a dotted line is drawn upward for the 2,500 units sold from the horizontal axis. The two dotted line meet at a point which indicates the point of total cost at 2,500 units.
The dotted line from sales is above the dotted line for total cost. This indicates the income from operations. Thus, the area in between the two dotted lines is the income from operations of
Verification:
| Determine the income from operations for 2,500 units | ||
| Particulars | Amount ($) | Amount ($) |
| Sales | 625,000 | |
| Less: Total Fixed costs | 108,750 | |
| Variable costs | 437,500 | (546,250) |
| Income from operations | 78,750 | |
Table (4)
Want to see more full solutions like this?
Chapter 5 Solutions
Bundle: Managerial Accounting, Loose-leaf Version, 14th - Book Only

- Bonita Industries reports the following ledger account balances at June 30, 2025: Cash $1158 Accounts receivable 2838 Inventory 3384 Prepaid rent 104 Equipment 320 Accumulated depreciation-equipment 66 Accounts payable 920 Unearned rent revenue 144 Common stock 220 Retained earnings 6740 Service revenue 392 Interest revenue 80 Salaries and wages expense 200 Insurance expense 98 Assuming that all of the accounts have normal balances, what are total credits on the company's trial balance at June 30, 2025? A. $8562. B. $8586. C. $8496. D. $8482.arrow_forwardA trial balance will balance even if A. a journal entry to record the purchase of equipment for cash of $52100 is not posted. B. a $13100 cash dividend is debited to dividends for $13100 and credited to cash for $1310. C. a $510 collection on accounts receivable is credited to accounts receivable for $510 without a corresponding debit. D. a purchase of supplies for $595 on account is debited to supplies for $595 and credited to accounts payable for $559.arrow_forwardEquipment costing $15200 is purchased by paying $3800 cash and signing a note payable for the remainder. The journal entry to record this transaction should include a credit to Notes Payable. credit to Notes Receivable. credit to Equipment. debit to Cash.arrow_forward
- At December 1, 2025, a company's Accounts Receivable balance was $20160. During December, the company had credit sales of $54000 and collected accounts receivable of $43200. At December 31, 2025, the Accounts Receivable balance is A. $30960 debit. B. $30960 credit. C. $74160 debit. D. $20160 debit.arrow_forwardWhispering Winds Corp.'s trial balance at the end of its first month of operations reported the following accounts and amounts with normal balances: Cash $14720 Prepaid insurance 460 Accounts receivable 2300 Accounts payable 1840 Notes payable 2760 Common stock 4600 Dividends 460 Revenues 20240 Expenses 11500 Total credits on Whispering Winds Corp's trial balance are A. $28980. B. $30360. C. $29900. D. $29440arrow_forwardSwifty Corporation's trial balance reported the following normal balances at the end of its first year: Cash $14440 Prepaid insurance 530 Accounts receivable 2660 Accounts payable 2130 Notes payable 3190 Common stock 4100 Dividends 530 Revenues 22040 Expenses 13300 What amount did Swifty Corporation's trial balance show as total credits? A. $31460 B. $32520 C. $30930 D. $31990arrow_forward
- Monty Inc., a major retailer of high-end office furniture, operates several stores and is a publicly traded company. The company is currently preparing its statement of cash flows. The comparative statement of financial position and income statement for Monty as at May 31, 2020, are as The following is additional information about transactions during the year ended May 31, 2020 for Monty Inc., which follows IFRS. Plant assets costing $69,000 were purchased by paying $47,000 in cash and issuing 5,000 common shares. In order to supplement its cash, Monty issued 4,000 additional common shares. Cash dividends of $35,000 were declered and paid at the end of the fiscal year. create direct method cash flow statement, show your workarrow_forwardFollowing is additional information about transactiona during the year ended May 31, 2020 for Monty Inc., which follows IFRS. Plant assets costing $69,000 were purchased by paying $47,000 in cash and issuing 5,000 common shares. In order to supplement iRs cash, Monty Issued 4,000 additional common shares. Cash dividends of $35,000 were declared and paid at the end of the fiscal year. PRepare a direct Method Cash FLow using the format.arrow_forwardmake a trail balancearrow_forward
- On July 31, 2025, the general ledger of Cullumber Legal Services Inc. showed the following balances: Cash $4,960, Accounts Receivable $1,860, Supplies $620, Equipment $6,200, Accounts Payable $5,080, Common Stock $4,340, and Retained Earnings $4,220. During August, the following transactions occurred. Aug. 3 5 Collected $1,490 of accounts receivable due from customers. Received $1,610 cash for issuing common stock to new investors. 6 Paid $3,350 cash on accounts payable. 7 Performed legal services of $8,060, of which $3,720 was collected in cash and the remainder was due on account. 2 2 2 2 2 12 Purchased additional equipment for $1,490, paying $500 in cash and the balance on account. 14 Paid salaries $4,340, rent $1,120, and advertising expenses $340 for the month of August. 18 20 24 26 27 Collected the balance for the services performed on August 7. Paid cash dividend of $620 to stockholders. Billed a client $1,240 for legal services performed. Received $2,480 from Laurentian Bank;…arrow_forwardplease solve this Questionarrow_forwardtest test 123arrow_forward
 Cornerstones of Cost Management (Cornerstones Ser...AccountingISBN:9781305970663Author:Don R. Hansen, Maryanne M. MowenPublisher:Cengage Learning
 Excel Applications for Accounting PrinciplesAccountingISBN:9781111581565Author:Gaylord N. SmithPublisher:Cengage Learning
 Managerial AccountingAccountingISBN:9781337912020Author:Carl Warren, Ph.d. Cma William B. TaylerPublisher:South-Western College Pub