
Concept explainers
Plot the shear diagram, bending moment diagram, axial force diagram, and the qualitative deflected shape of the frame.
Explanation of Solution
Write the condition for static instability, determinacy and indeterminacy of plane frames as follows:
Here, number of members is m, number of external reactions is r, the number of joints is j, and the number of elastic hinges is
Find the degree of static indeterminacy (i) using the equation;
Refer to the Figure in the question;
The number of members (m) is 3.
The number of external reactions (r) is 3.
The number of joints (j) is 4.
The number of elastic hinges
Substitute the values in Equation (2);
Show the free-body diagram of the entire frame as in Figure 1.
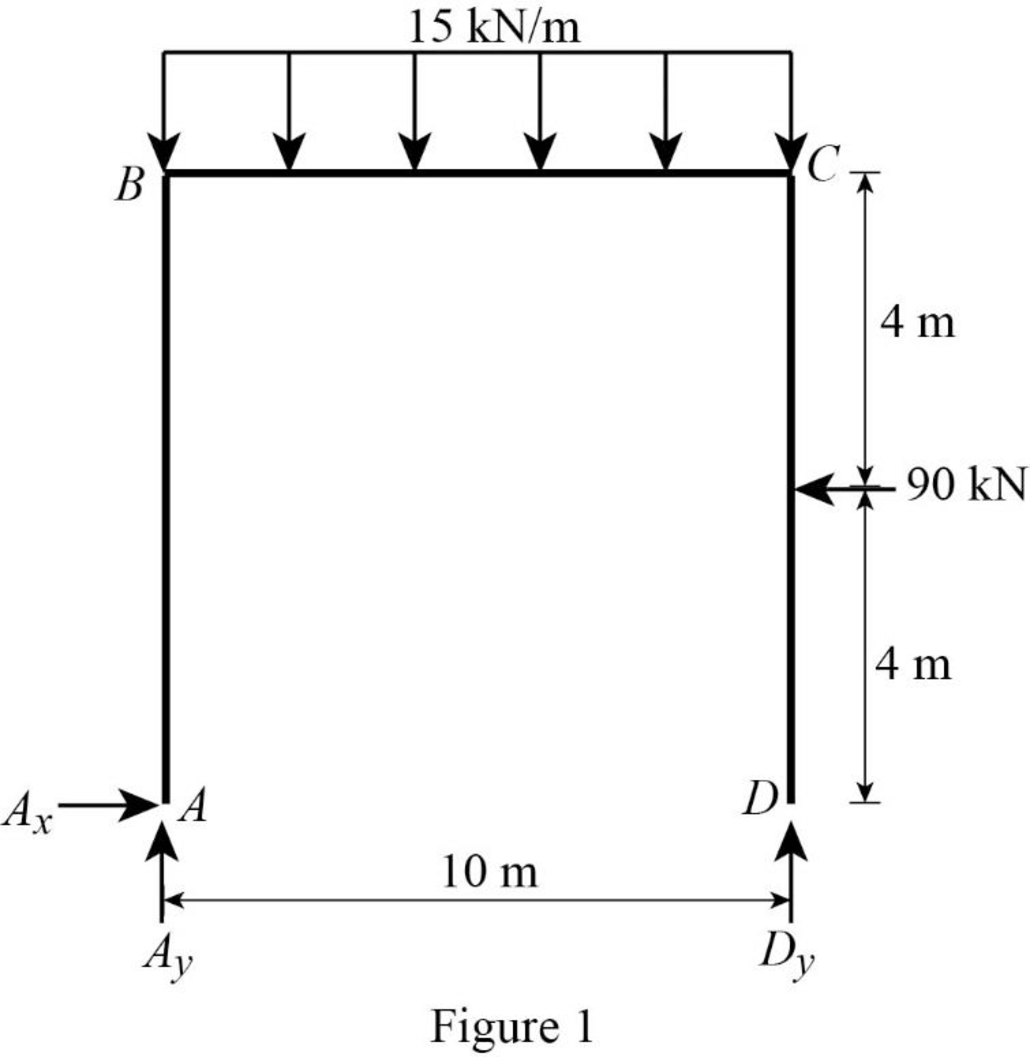
Refer Figure 1,
Find the vertical reaction at point D by taking moment about point A.
Find the vertical reaction at point A by resolving the vertical component of forces.
Find the horizontal reaction at point A by resolving the horizontal component of forces.
Show the free-body diagram of the members and joints of the entire frame as in Figure 2.
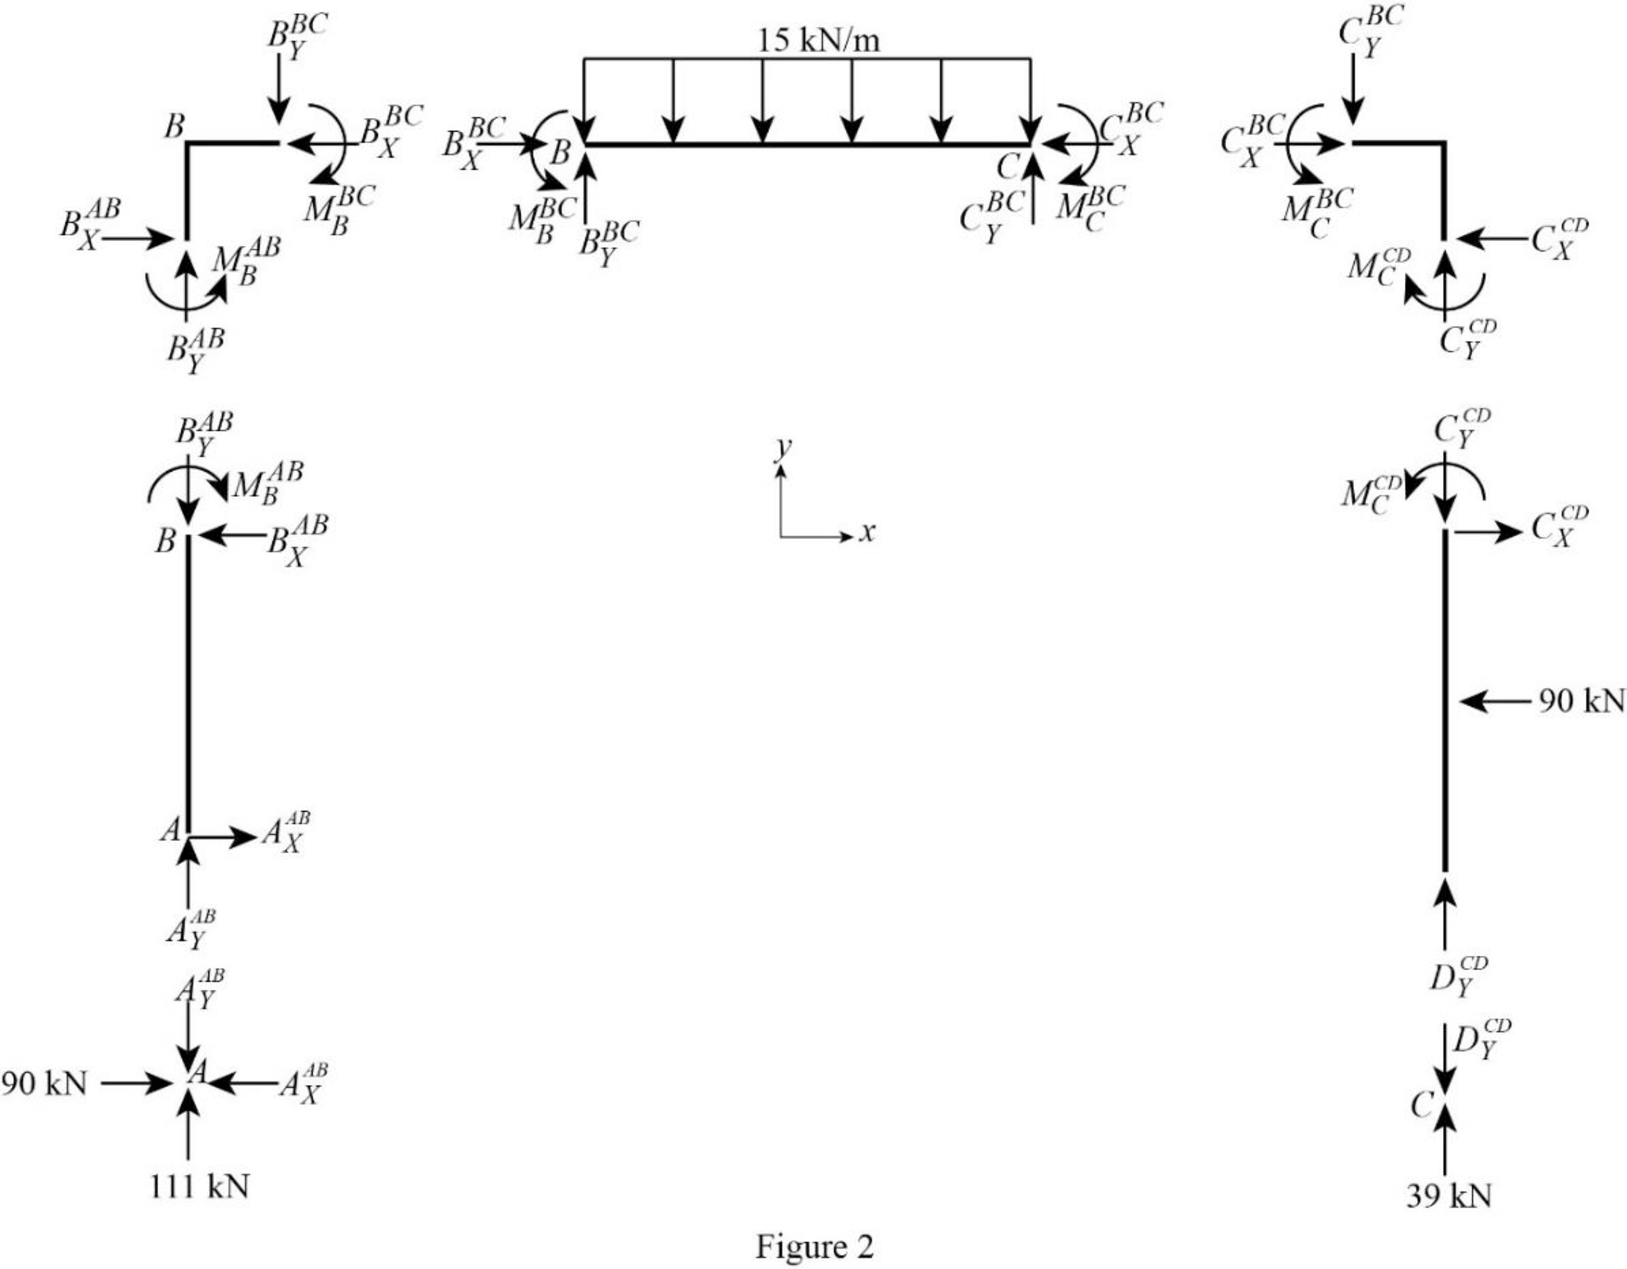
Consider point A:
Resolve the vertical component of forces.
Resolve the horizontal component of forces.
Consider the member AB:
Resolve the vertical component of forces.
Resolve the horizontal component of forces.
Take moment about the point B.
Consider the point B:
Resolve the vertical component of forces.
Resolve the horizontal component of forces.
Take moment about the point B.
Consider the member BC:
Resolve the vertical component of forces.
Resolve the horizontal component of forces.
Take moment about the point C.
Consider the point C:
Resolve the vertical component of forces.
Resolve the horizontal component of forces.
Take moment about the point C.
Consider the point D:
Resolve the vertical component of forces.
Plot the moment end forces of the frame as in Figure 3.
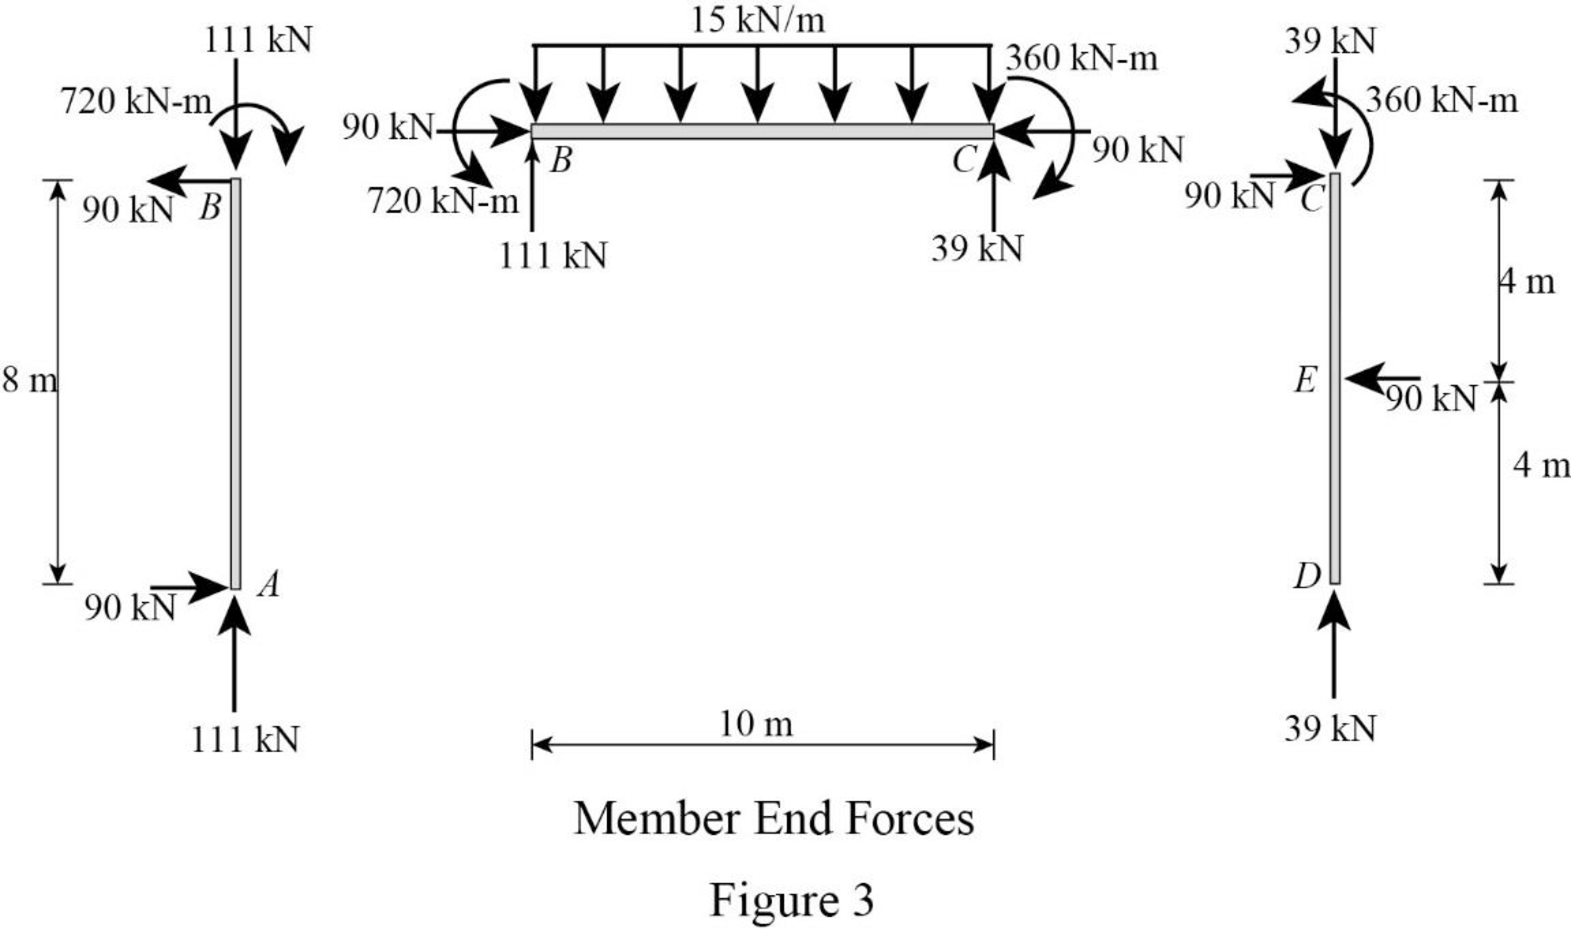
Refer to the moment end force diagram plot the shear diagram, bending moment diagram, and the axial force diagrams.
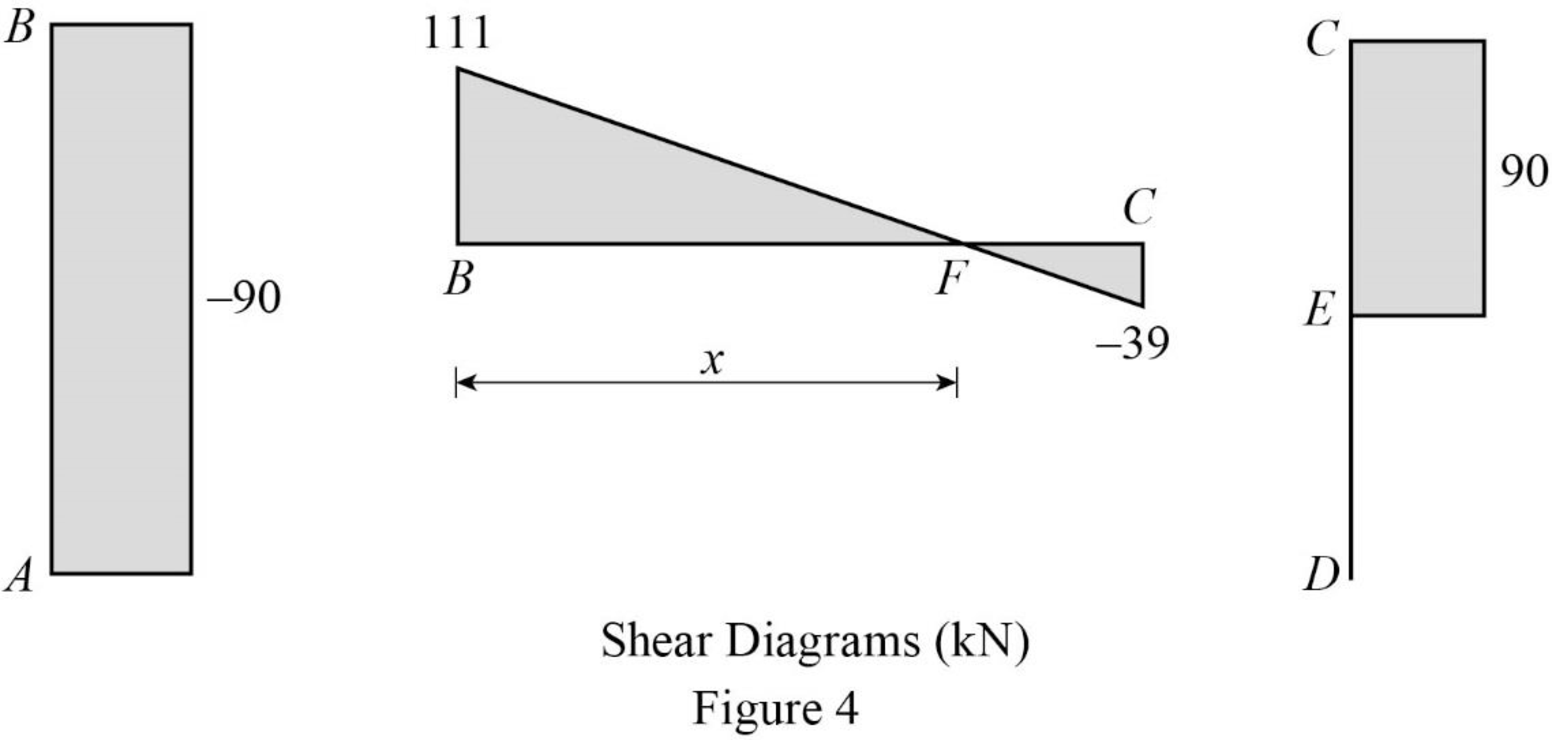
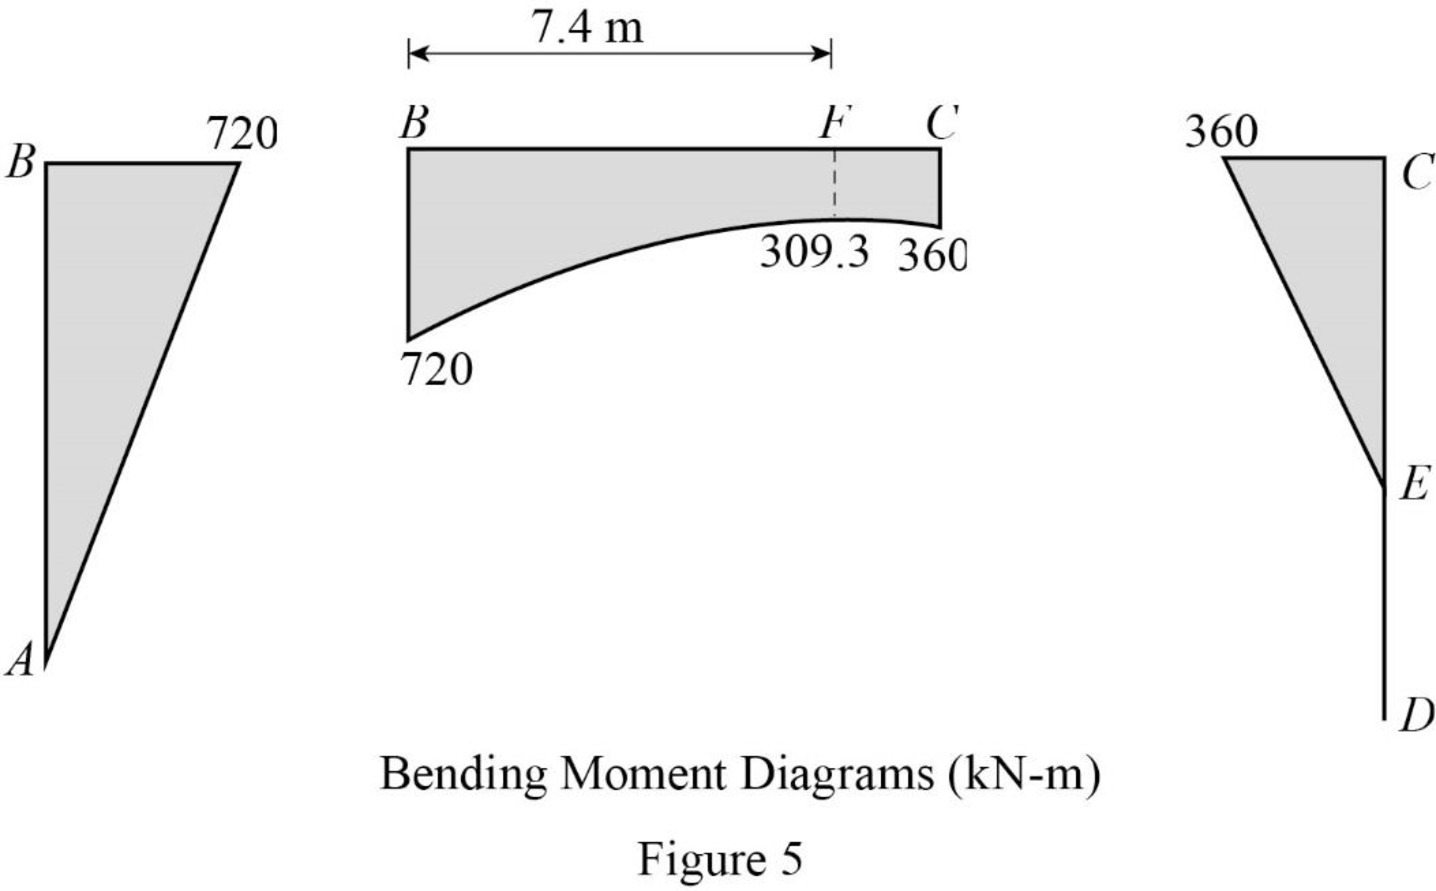
Refer to the shear force diagram, the maximum bending moment occurs at point F where the shear force changes sign.
Use similar triangle concept for the region BC:
Plot the shear force diagram as in Figure 4.
Plot the bending moment diagram as in Figure 5.
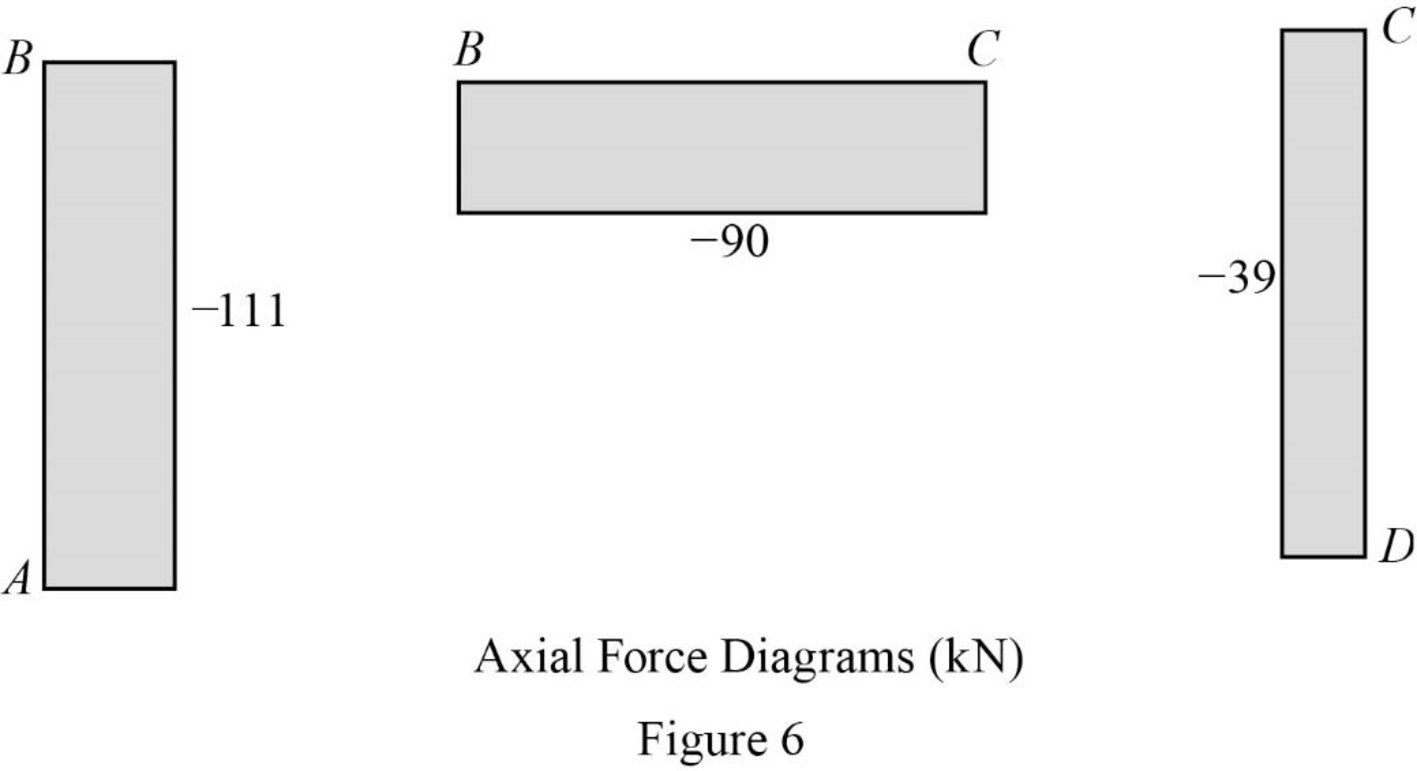
Plot the axial force diagram as in Figure 6.
Want to see more full solutions like this?
Chapter 5 Solutions
Structural Analysis, SI Edition


- A 2.0 m wide strip foundation carries a wall load of 350 kN/m in a clayey soil where y = 15 kN/m³, c' = 5.0 kN/m² and ' = 23°. The foundation depth is 1.5 m. For ' = 23°: Nc = 18.05; N₁ = 8.66; Ny = = = 8.20. Determine the factor of safety using the equation below. qu= c' NcFcs FcdFci+qNqFqsFq 1 F + gd. 'qi 2 ·BN√· FF γί Ysyd F (Enter your answer to three significant figures.) FS =arrow_forward2P -1.8 m- -1.8 m- -B Wo P -1.8 m- Carrow_forwardPart F: Progressive activity week 7 Q.F1 Pick the rural location of a project site in Victoria, and its catchment area-not bigger than 25 sqkm, and given the below information, determine the rainfall intensity for ARI 5, 50, 100 year storm event. Show all the details of the procedure. Each student must propose different length of streams and elevations. Use fig below as a sample only. Pt. E-nt 950 200 P: D-40, PC-92.0 300m 300m 000m PL.-02.0 500m HI-MAGO PLA-M 91.00 To be deemed satisfactory the solution must include: Q.F1.1.Choice of catchment location Q.F1.2. A sketch displaying length of stream and elevation Q.F1.3. Catchment's IFD obtained from the Buro of Metheorology for specified ARI Q.F1.4.Calculation of the time of concentration-this must include a detailed determination of the equivalent slope. Q.F1.5.Use must be made of the Bransby-Williams method for the determination of the equivalent slope. Q.F1.6.The graphical display of the estimation of intensities for ARI 5,50, 100…arrow_forward
- I need help finding: -The axial deflection pipe in inches. -The lateral deflection of the beam in inches -The total deflection of the beam like structure in inches ?arrow_forwardA 2.0 m wide strip foundation carries a wall load of 350 kN/m in a clayey soil where y = 17 kN/m³, c' = 5.0 kN/m² and 23°. The foundation depth is 1.5 m. For o' = 23°: Nc = 18.05; N = 8.66; N = 8.20. Determine the factor of safety using the equation below. 1 qu = c' NcFcs Fed Fci +qNqFqs FqdFqi + ½ BN F√s 1 2 (Enter your answer to three significant figures.) s Fyd Fi FS =arrow_forward1.2 m BX B 70 kN.m y = 16 kN/m³ c' = 0 6'-30° Water table Ysat 19 kN/m³ c' 0 &' = 30° A square foundation is shown in the figure above. Use FS = 6, and determine the size of the foundation. Use the Prakash and Saran theory (see equation and figures below). Suppose that F = 450 kN. Qu = BL BL[c′Nc(e)Fcs(e) + qNg(e)Fcs(e) + · 1 YBN(e) F 2 7(e) Fra(e)] (Enter your answer to two significant figures.) B: m Na(e) 60 40- 20- e/B=0 0.1 0.2 0.3 .0.4 0 0 10 20 30 40 Friction angle, ' (deg) Figure 1 Variation of Na(e) with o' Ny(e) 60 40 20 e/B=0 0.3 0.1 0.2 0.4 0 0 10 20 30 40 Friction angle, ' (deg) Figure 2 Variation of Nye) with o'arrow_forward
- K/S 46. (O المهمات الجديدة 0 المنتهية 12 المغـ ۱۱:۰۹ search ليس لديك اي مهمات ☐ ○ ☑arrow_forwardI need help setti if this problem up and solving. I keep doing something wrong.arrow_forward1.0 m (Eccentricity in one direction only)=0.15 m Call 1.5 m x 1.5m Centerline An eccentrically loaded foundation is shown in the figure above. Use FS of 4 and determine the maximum allowable load that the foundation can carry if y = 18 kN/m³ and ' = 35°. Use Meyerhof's effective area method. For '=35°, N = 33.30 and Ny = 48.03. (Enter your answer to three significant figures.) Qall = kNarrow_forward
- What are some advantages and disadvantages of using prefabrication in construction to improve efficiency and cut down on delays?arrow_forwardPROBLEM:7–23. Determine the maximum shear stress acting in the beam at the critical section where the internal shear force is maximum. 3 kip/ft ΑΟ 6 ft DiC 0.75 in. 6 ft 6 in. 1 in. F [ 4 in. C 4 in. D 6 in. Fig of prob:7-23 1 in. 6 ft Barrow_forward7.60 This abrupt expansion is to be used to dissipate the high-energy flow of water in the 5-ft-diameter penstock. Assume α = 1.0 at all locations. a. What power (in horsepower) is lost through the expansion? b. If the pressure at section 1 is 5 psig, what is the pressure at section 2? c. What force is needed to hold the expansion in place? 5 ft V = 25 ft/s Problem 7.60 (2) 10 ftarrow_forward
