Concept explainers
Interpretation of Regression Results: Simple Regression
Your company is preparing an estimate of its production costs for the coming period. The controller estimates that direct materials costs are $45 per unit and that direct labor costs are $21 per hour. Estimating
The controller’s office estimated overhead costs at $3,600 for fixed costs and $18 per unit for variable costs. Your colleague, Lance, who graduated from a rival school, has already done the analysis and reports the “correct” cost equation as follows:
Overhead = $10,600 + $16.05 per unit
Lance also reports that the correlation coefficient for the regression is .82 and says, “With 82 percent of the variation in overhead explained by the equation, it certainly should be adopted as the best basis for estimating costs.”
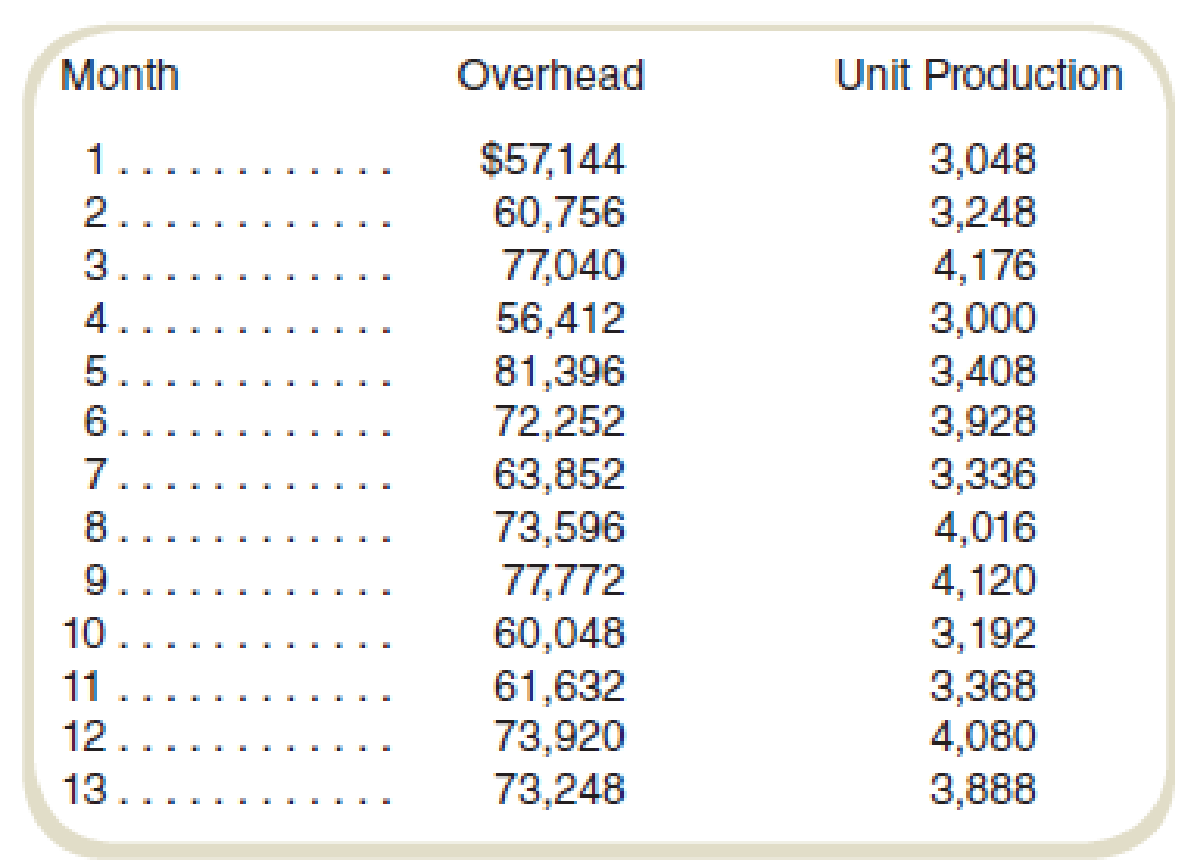
When asked for the data used to generate the regression, Lance produces the following:
Required
The company controller is somewhat surprised that the cost estimates are so different. You have therefore been assigned to check Lance’s equation. You accept the assignment with glee.
Analyze Lance’s results and state your reasons for supporting or rejecting his cost equation.
Want to see the full answer?
Check out a sample textbook solutionChapter 5 Solutions
Fundamentals Of Cost Accounting (6th Edition)
- The management of Hartman Company is trying to determine the amount of each of two products to produce over the coming planning period. The following information concerns labor availability, labor utilization, and product profitability: a. Develop a linear programming model of the Hartman Company problem. Solve the model to determine the optimal production quantities of products 1 and 2. b. In computing the profit contribution per unit, management does not deduct labor costs because they are considered fixed for the upcoming planning period. However, suppose that overtime can be scheduled in some of the departments. Which departments would you recommend scheduling for overtime? How much would you be willing to pay per hour of overtime in each department? c. Suppose that 10, 6, and 8 hours of overtime may be scheduled in departments A, B, and C, respectively. The cost per hour of overtime is 18 in department A, 22.50 in department B, and 12 in department C. Formulate a linear programming model that can be used to determine the optimal production quantities if overtime is made available. What are the optimal production quantities, and what is the revised total contribution to profit? How much overtime do you recommend using in each department? What is the increase in the total contribution to profit if overtime is used?arrow_forwardIdentify cost graphs The following cost graphs illustrate various types of cost behavior: For each of the following costs, identify the cost graph that best illustrates its cost behavior as the number of units produced increases: A. Total direct materials cost B. Electricity costs of 1,000 per month plus 0.10 per kilowatt-hour C. Per-unit cost of straight-line depreciation on factory equipment D. Salary of quality control supervisor, 20,000 per month E. Per-unit direct labor costarrow_forwardMethod of Least Squares, Predicting Cost for Different Time Periods from the One Used to Develop a Cost Formula Refer to the information for Farnsworth Company on the previous page. However, assume that Tracy has used the method of least squares on the receiving data and has gotten the following results: Required: 1. Using the results from the method of least squares, prepare a cost formula for the receiving activity. 2. Using the formula from Requirement 1, what is the predicted cost of receiving for a month in which 1,450 receiving orders are processed? (Note: Round your answer to the nearest dollar.) 3. Prepare a cost formula for the receiving activity for a quarter. Based on this formula, what is the predicted cost of receiving for a quarter in which 4,650 receiving orders are anticipated? Prepare a cost formula for the receiving activity for a year. Based on this formula, what is the predicted cost of receiving for a year in which 18,000 receiving orders are anticipated?arrow_forward
- Scattergraph, High-Low Method, and Predicting Cost for a Different Time Period from the One Used to Develop a Cost Formula Refer to the information for Farnsworth Company on the previous page. Required: 1. Prepare a scattergraph based on the 10 months of data. Does the relationship appear to be linear? 2. Using the high-low method, prepare a cost formula for the receiving activity. Using this formula, what is the predicted cost of receiving for a month in which 1,450 receiving orders are processed? 3. Prepare a cost formula for the receiving activity for a quarter. Based on this formula, what is the predicted cost of receiving for a quarter in which 4,650 receiving orders are anticipated? Prepare a cost formula for the receiving activity for a year. Based on this formula, what is the predicted cost of receiving for a year in which 18,000 receiving orders are anticipated? Use the following information for Problems 3-60 and 3-61: Farnsworth Company has gathered data on its overhead activities and associated costs for the past 10 months. Tracy Heppler, a member of the controllers department, has convinced management that overhead costs can be better estimated and controlled if the fixed and variable components of each overhead activity are known. One such activity is receiving raw materials (unloading incoming goods, counting goods, and inspecting goods), which she believes is driven by the number of receiving orders. Ten months of data have been gathered for the receiving activity and are as follows:arrow_forwardXYZ Company's accountant is estimating next period's total overhead costs (Y). She performed three regression analyses, the first is based on direct labor hours (DLH), the second is based on machine hours (Mhr), and the third is based on quantity produced (Q). The results were: [Y=$95,000+ $9×DLH; R-square Y=190,000+2Q; R-square-D0.55]. How much of the variations on the overhead costs is explained 0.90]; [Y= $120,000 $5xMhr; R-square = 0.10]; by the machine hours (Mhr)? Select one: O a. 90% Ob. None of the answers given Oc.45% O6.55% Oe. 10% Next page pagearrow_forwardFor a simple regression analysis model that is used to allocate factory overhead, an internal auditor finds that the intersection of the line of best fit for the overhead allocation with the y-axis is $14,000. The slope of the line is 0.2. The independent variable, factory wages, amounts to $810,000 for the month. What is the estimated amount of factory overhead to be allocated for the month? Multiple Choice $289,400. $162.000. $68,000. $88,000.arrow_forward
- Using the least-squares method of analyzing costs, answer the following questions and show computations to support your answers. a. What is the estimated variable portion of maintenance costs per labor hour? B.What is the estimated fixed maintenance cost each month? C.Formulate the regression equation D.If it is estimated that 600 labor hours will be used in July, what is the expected total power cost for July?arrow_forwardThe graphs below represent cost behavior patterns that might occur in a company’s cost structure. The vertical axis represents total cost, and the horizontal axis represents activity output Required:For each of the following situations, choose the graph from the group a–1 that best illustrates the cost pattern involved. Also, for each situation, identify the driver that measures activity output.1. The cost of power when a fixed fee of $500 per month is charged plus an additional charge of $0.12 per kilowatt-hour used.2. Commissions paid to sales representatives. Commissions are paid at the rate of 5 percent of sales made up to total annual sales of $500,000, and 7 percent of sales above $500,000.3. A part purchased from an outside supplier costs $12 per part for the first 3,000 parts and $10 per part for all parts purchased in excess of 3,000 units.4. The cost of surgical gloves, which are purchased in increments of 100 units (gloves come in boxes of 100 pairs).5. The cost of tuition…arrow_forwardXYZ Company's accountant is estimating next period's total overhead costs (Y). She performed three regression analyses, the first is based on direct labor hours (DLH), the second is based on machine hours (Mhr). and the third is based on quantity produced (Q). The results were: [Y-$150,000 + $10×DLH; R-square 0.95]: [Y= $190,000 $5xMhr. R-square = 0.11] [Y=200,000+20 R-square=0.52] Based on this information, %3D which cost driver do you recommend? Select one: O a. All cost drivers are the same Ob. None of them Oc Machine hours (Mhr) O d. Direct labor hours (DLH) Oe. Quantity produced (Q)arrow_forward
- Data table Month Total Cost Machine Hours January.. 3,420 1,090 February..... S 3,760 1,120 March .... $ 3,532 1,080 April ..... 3,720 1,220 May S 4,800 1,330 June 4,192 1,480 .. %24 %24arrow_forwardThe controller at Wesson Company's manufacturing plant has provided you with the following information for the first quarter's operations: Direct materials Fixed manufacturing overhead costs Sales price Variable manufacturing overhead Direct labor Fixed marketing and administrative costs Units produced and sold during the quarter Variable marketing and administrative costs Required: a. Prepare a gross margin income statement. b. Prepare a contribution margin income statement. Complete this question by entering your answers Required A Required B Prepare a contribution margin income statement. Contribution Margin Income Statementarrow_forwardAs a new accountant of the company, you are provided with the following information related to KOKO: Product Annual production and sales unit Direct material cost per unit Direct labour cost per unit Machine hours per unit Selling price per unit Koko 5,500 RM50 RM35 3 hours RM150 The company is considering of changing the traditional method to the Activity Based Costing (ABC) method. In order to adopt ABC method the following information is required: Activity Cost Cost Driver Pool Expected overhead Expected use of drivers per product Other products 3,500 costs Коко (RM) No of purchase orders Machine hours Maintenance Maintenance hours Number of inspections Total Purchasing 4,000 37,500 Machining 16,500 8,000 1,500 147,000 43,000 3,500 Quality control 1900 1600 17,500 245,000 Required: a. If the company decided to use the Activity Based Costing (ABC) method, determine the cost per unit of KOKO. Based on your answer in (a), advise whether the company should change to ABC method. Support…arrow_forward
- Managerial Accounting: The Cornerstone of Busines...AccountingISBN:9781337115773Author:Maryanne M. Mowen, Don R. Hansen, Dan L. HeitgerPublisher:Cengage LearningEssentials of Business Analytics (MindTap Course ...StatisticsISBN:9781305627734Author:Jeffrey D. Camm, James J. Cochran, Michael J. Fry, Jeffrey W. Ohlmann, David R. AndersonPublisher:Cengage LearningManagerial AccountingAccountingISBN:9781337912020Author:Carl Warren, Ph.d. Cma William B. TaylerPublisher:South-Western College Pub
- Financial And Managerial AccountingAccountingISBN:9781337902663Author:WARREN, Carl S.Publisher:Cengage Learning,