Concept explainers
Cost Estimation: Simple and Multiple Regression Using a Spreadsheet (Appendix A)
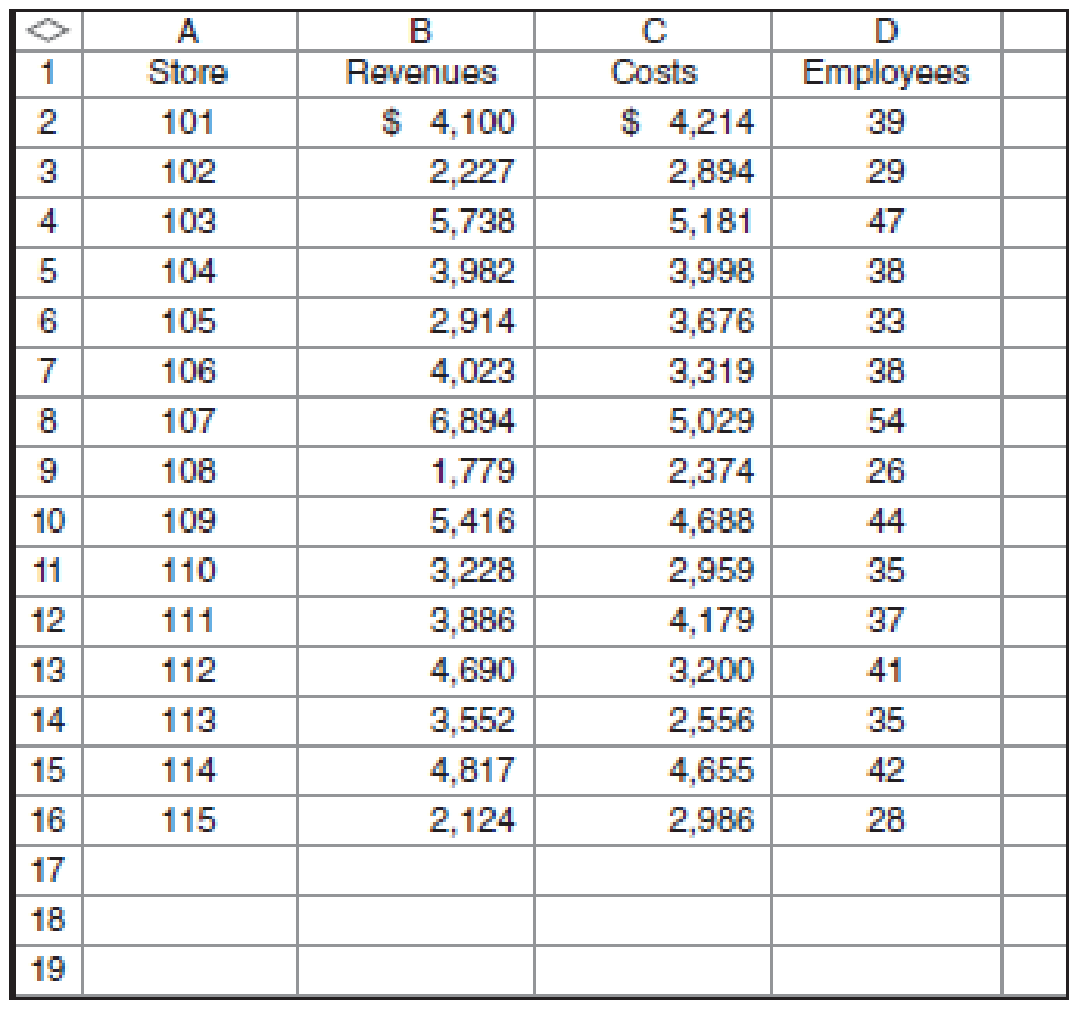
Recall the analysis for Davis Stores in Exercises 5-39, 5-40, and 5-41. During a discussion of those results, one of the managers suggests that number of employees might be better at explaining cost than store revenues. As a result of that suggestion, managers collected information on the number of employees and combined it with their original data.

Required
- a. Use the high-low method to estimate the fixed and variable portions of store costs based on employees.
- b. Use the results of your high-low analysis to estimate the cost for a store with 30 employees.
- c. Prepare a scattergraph between store cost and employees.
- d. Prepare an estimate of the cost of a store with 30 employees using the results from a simple regression of store cost on employees.
- e. Prepare an estimate of the cost of a store with revenues of $2.5 million and 30 employees using the results of a multiple regression of store costs on store revenues and employees.
- f. Comment on the results of the regression analyses in parts d and e. (Hint: Consider how the managers of Davis Stores might staff their stores and what this might mean for the data being used in the multiple regression analysis.)
a.
Use the high-low method to estimate the fixed and variable portions of store costs based on employees.
Explanation of Solution
High-low cost method:
High-low cost method helps in separating the fixed and variable cost from the total cost. It is calculated by comparing the highest and lowest level of activities and the cost of these activities.
Show the cost equation of fixed and variable cost with the overhead cost:
Thus, the cost equation is:
Working note 1:
Calculate the fixed cost:
Calculate the highest and lowest activity:
| Particular | Employees | Cost |
| Highest activity | 54 | $5,029 |
| Lowest activity | 26 | $2,374 |
Table: (1)
Working note 2:
Calculate the variable cost (unit) with the help of high-low cost method:
Working note 3:
Calculate the variable cost ($) with the help of high-low cost method:
b.
Use the results of your high-low analysis to estimate the cost for a store with 30 employees.
Explanation of Solution
Total cost of store:
Total cost of the store includes the fixed and variable cost of the production. It is calculated by the cost equation.
Estimate the cost for the store:
Thus, the estimated cost for the store is $2,753.
c.
Prepare a scatter graph between store cost and employees.
Explanation of Solution
Scatter graph:
Scatter graph shows the relationship between the cost and the activity. It shows the cost at various level of activity. It helps in finding the outlier in the data. So the management can eliminate it to make more effective decisions.
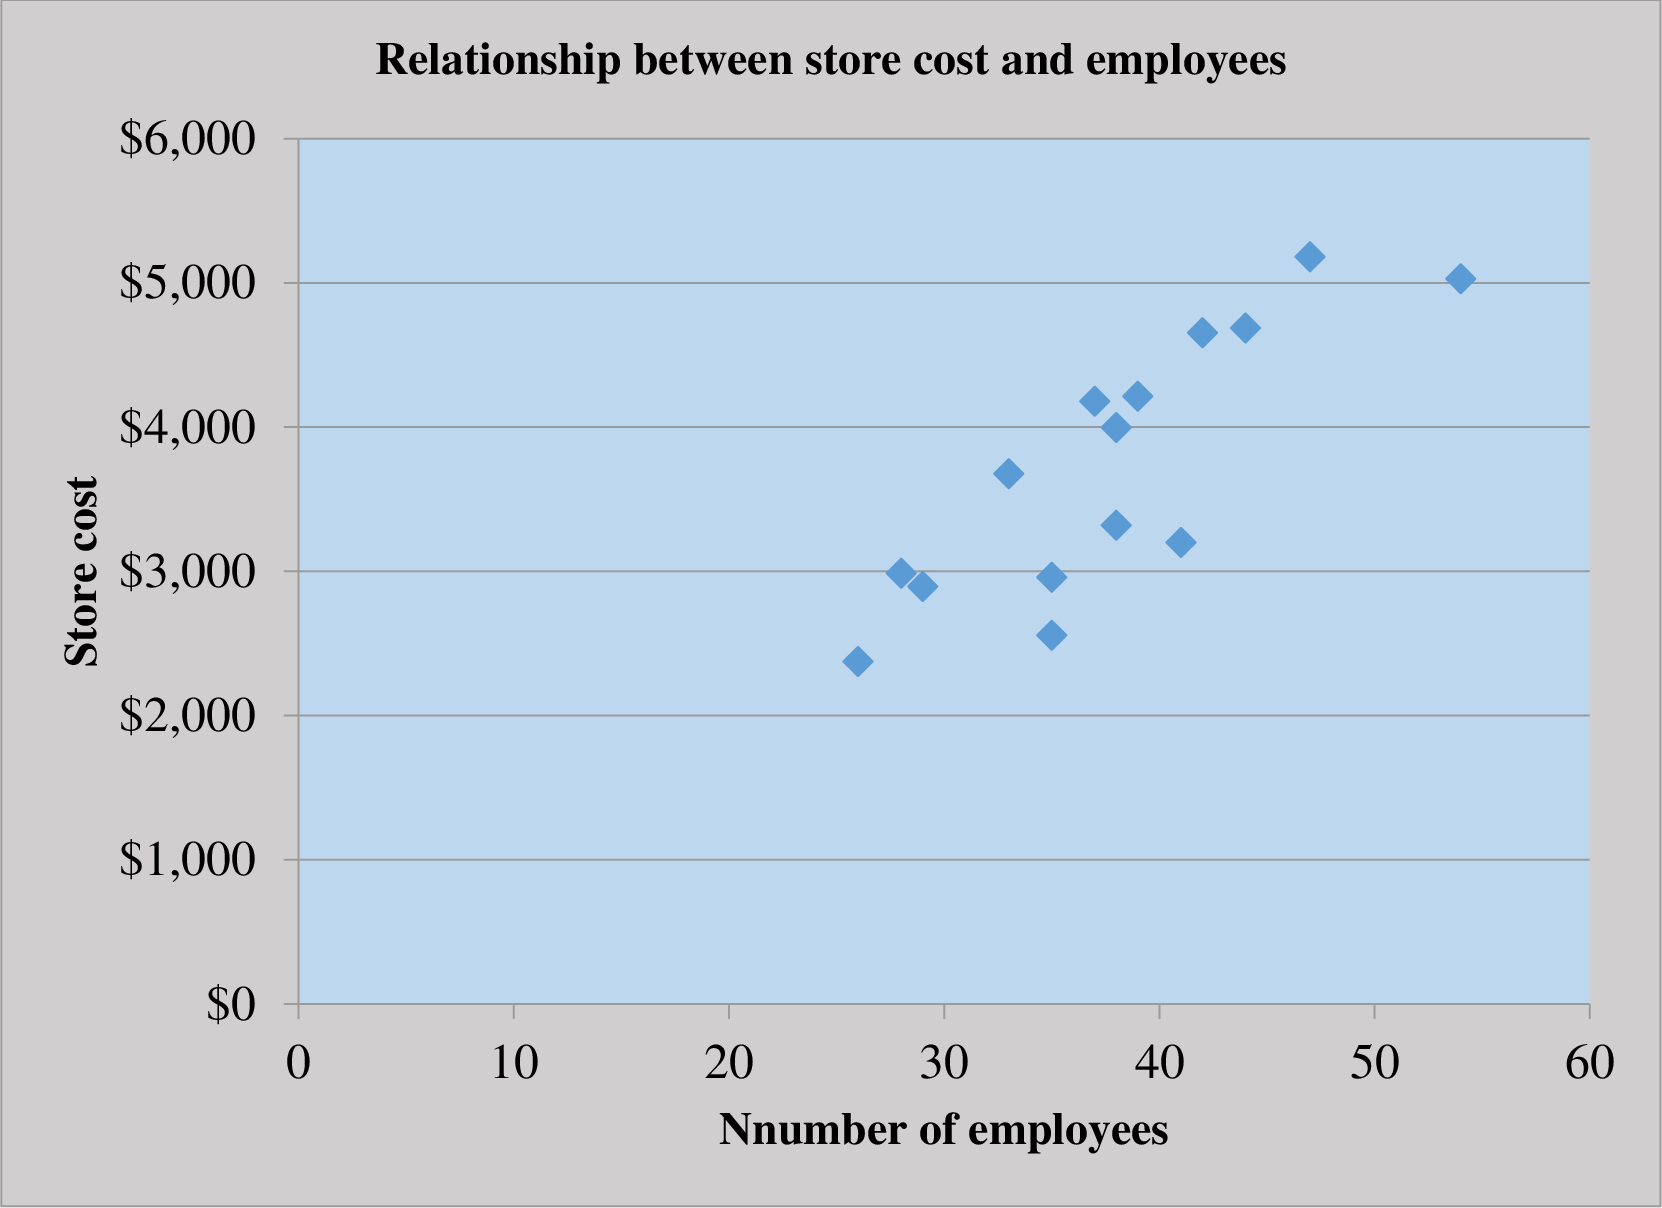
Prepare the scatter graph for store cost and employee:

The scatter plot represents number of employees on the horizontal axis and the store cost on the vertical axis. The points on the scatter plot do not seem to form the linear pattern and there is not a healthy relationship as well.
d.
Prepare an estimate of the cost of a store with 30 employees using the results from a simple regression of store cost on employees.
Answer to Problem 60P
The store cost is $2,930.
Explanation of Solution
Cost equation:
Cost equation is a mathematical representation of the cost estimation at various level of activity. It is used by defining the fixed cost and variable cost per unit and then the variable cost per unit is multiplied by the given variable to calculate the relative cost.
Thus, the store cost is $2,930.
e.
Prepare an estimate of the cost of a store with revenues of $2.5 million and 30 employees using the results of a multiple regression of store costs on store revenues and employees.
Explanation of Solution
Multiple regressions:
Multiple regressions use two or more activities (variables) to establish the relationship between cost and activities:
Thus, the store cost is $2,935.8.
f.
Comment on the results of the regression analyses in parts d and e.
Explanation of Solution
Regression analysis:
Regression analysis is used to show the relationship between the cost and the activity. It is used to estimate the cost at various level of activity.
The most important step in the calculation of regression analysis is to establish a logical relationship between the cost and the activity. The activity (independent variable) is placed on the right-hand-side and the cost (dependant variable) is placed on the left-hand-side of the graph.
Comment on the results of the regression analyses:
In case of simple and multiple regressions, the both of the coefficients are not very significant. But the both the R2 are similar and significant. This kind of problem arises when two or more independent variables in a multiple regression analyses are related to each other.
In the given case, the number of employees and revenue are closely related.
Want to see more full solutions like this?
Chapter 5 Solutions
Fundamentals of Cost Accounting
- dont use ai What is the effect of a debit to an expense account?A. Decreases expensesB. Increases equityC. Increases expensesD. Decreases assetsarrow_forwardFill in the attached balance sheet with the data provided on the SEC for years 2020, 2021 and 22 NIKE, INC BALANCE SHEET Financial Statements 2020 2021 2022 Assets Current Assets Cash and Cash Equivalents [insert value] [insert value] [insert value] Accounts Receivable Net [insert value] [insert value] [insert value] Inventory [insert value] [insert value] [insert value] Other Current Assets [insert value] [insert value] [insert value] Total Current Assets $ - $ - $ - Non-Current Assets Property, Plant and Equipment Net [insert value] [insert value] [insert value] Intangibles [insert value] [insert value] [insert value] Other Assets [insert value] [insert value] [insert value] Total Non-Current/Fixed Assets $ - $…arrow_forwardWhat is the effect of a debit to an expense account?A. Decreases expensesB. Increases equityC. Increases expensesD. Decreases assets helparrow_forward
- No chatgpt What is the effect of a debit to an expense account?A. Decreases expensesB. Increases equityC. Increases expensesD. Decreases assetsarrow_forwardWhat is the effect of a debit to an expense account?A. Decreases expensesB. Increases equityC. Increases expensesD. Decreases assetsneed helparrow_forwardWhat is the effect of a debit to an expense account?A. Decreases expensesB. Increases equityC. Increases expensesD. Decreases assetsarrow_forward
- No AI 4. If total debits exceed total credits on a trial balance, the difference is most likely:A. A net lossB. A recording errorC. A net incomeD. An overstatement of assetsarrow_forwardNeed help ! 4. If total debits exceed total credits on a trial balance, the difference is most likely:A. A net lossB. A recording errorC. A net incomeD. An overstatement of assetsarrow_forward4. If total debits exceed total credits on a trial balance, the difference is most likely:A. A net lossB. A recording errorC. A net incomeD. An overstatement of assetsarrow_forward
- Calculate the times-interest-earned ratios for PEPSI CO, Given the following informationarrow_forwardCalculate the times-interest-earned ratios for Coca Cola in 2020. Explain if the times-interest-earned ratios is adequate? Is the times-interest-earned ratio greater than or less than 2.5? What does that mean for the companies' income? Can the company afford the interest expense on a new loan?arrow_forwardWhich of the following is a temporary account?A. EquipmentB. Accounts PayableC. Utilities ExpenseD. Common Stockarrow_forward
 Cornerstones of Cost Management (Cornerstones Ser...AccountingISBN:9781305970663Author:Don R. Hansen, Maryanne M. MowenPublisher:Cengage Learning
 Managerial Accounting: The Cornerstone of Busines...AccountingISBN:9781337115773Author:Maryanne M. Mowen, Don R. Hansen, Dan L. HeitgerPublisher:Cengage LearningPrinciples of Accounting Volume 2AccountingISBN:9781947172609Author:OpenStaxPublisher:OpenStax College
 Managerial AccountingAccountingISBN:9781337912020Author:Carl Warren, Ph.d. Cma William B. TaylerPublisher:South-Western College Pub
 Financial And Managerial AccountingAccountingISBN:9781337902663Author:WARREN, Carl S.Publisher:Cengage Learning,
 Principles of Cost AccountingAccountingISBN:9781305087408Author:Edward J. Vanderbeck, Maria R. MitchellPublisher:Cengage Learning


