
Concept explainers
Videos
Interpretation:
The molar mass of polychloroprene and its second osmotic virial coefficient has to be calculated.
Concept Introduction:
When large molecules dissolve to produce solutions that are not ideal solutions, it is assumed that the Van’t Hoff equation is the first term of the virial like expansion. The osmotic virial equation is,
Answer to Problem 5B.9P
The molar mass of polychloroprene is
Explanation of Solution
The equation used to determine the molar mass from osmotic pressure is,
Where,
The given data is,
The plot of
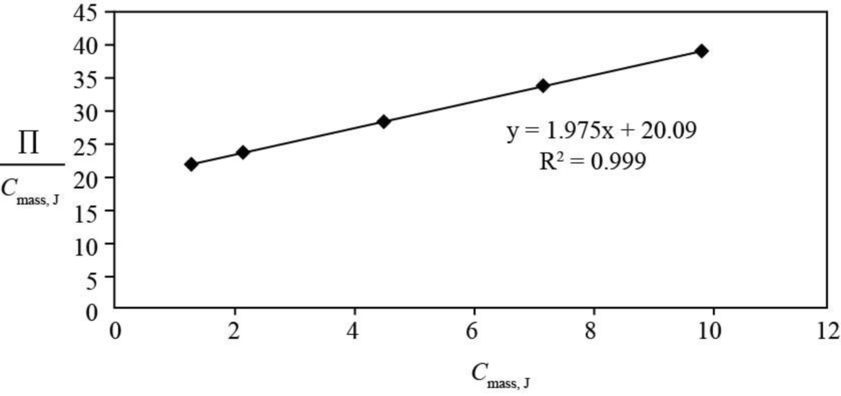
Figure 1
From the plot intercept is
The intercept of the plot of
The value of
The conversion of temperature,
The value of
The value of
The conversion of
Substitute the values of
The molar mass of polychloroprene is
The slope of the plot of
Substitute the value of
The conversion of
Hence, the conversion of
The value of second osmotic virial coefficient is
Want to see more full solutions like this?
Chapter 5 Solutions
Atkins' Physical Chemistry


- please help fill in the tablearrow_forwardAnswer F pleasearrow_forward4. Refer to the data below to answer the following questions: The octapeptide saralasin is a specific antagonist of angiotensin II. A derivative of saralasin is used therapeutically as an antihypertensive. Amino acid analysis of saralasin show the presence of the following amino acids: Ala, Arg, His, Pro, Sar, Tyr, Val, Val A.Sar is the abbreviation for sarcosine, N-methyl aminoethanoic acid. Draw the structure of sarcosine. B. N-Terminal analysis by the Edman method shows saralasin contains sarcosine at the N-terminus. Partial hydrolysis of saralasin with dilute hydrochloric acid yields the following fragments: Tyr-Val-His Sar-Arg-Val His-Pro-Ala Val-Tyr-Val Arg-Val-Tyr What is the structure of saralasin?arrow_forward
- What is the structure of the DNA backbone?arrow_forwardPLEASE PLEASE PLEASE use hand drawn structures when possarrow_forward. M 1- MATCH each of the following terms to a structure from the list below. There is only one correct structure for each term and structures may be used more than once. Place the letter of the structure in the blank to the left of the corresponding term. A. Sanger dideoxy method C. Watson-Crick B. GAUCGUAAA D. translation E. HOH2C OH OH G. transcription I. AUGGCUGAG 0 K. OPOH2C 0- OH N- H NH2 F. -OPOH2C 0- OH OH H. Maxam-Gilbert method J. replication N L. HOH2C a. b. C. d. e. f. g. B M. AGATCGCTC a pyrimidine nucleoside RNA base sequence with guanine at the 3' end. DNA base sequence with cytosine at the 3' end. a purine nucleoside DNA sequencing method for the human genome 2'-deoxyadenosine 5'-phosphate process by which mRNA directs protein synthesis OH NH2arrow_forward
- Please use hand drawn structures when neededarrow_forwardB. Classify the following amino acid. Atoms other than carbon and hydrogen are labeled. a. acidic b. basic C. neutral C. Consider the following image. Which level of protein structure is shown here? a. primary b. secondary c. tertiary d. quaternary D. Consider the following image. H RH H HR H R HR HR RH Which level of protein structure is shown in the box? a. primary b. secondary R c. tertiary d. quaternary コー Rarrow_forwardBriefly answer three from the followings: a. What are the four structures of the protein? b. Why is the side chain (R) attached to the alpha carbon in the amino acids is important for the function? c. What are the types of amino acids? And how is it depend on the (R) structure? d. Write a reaction to prepare an amino acid. prodarrow_forward
- Answe Answer A and B pleasearrow_forward3. Refer to the data below to answer the following questions: Isoelectric point Amino Acid Arginine 10.76 Glutamic Acid 3.22 Tryptophan 5.89 A. Define isoelectric point. B. The most basic amino acid is C. The most acidic amino acid is sidizo zoarrow_forward3. A gas mixture contains 50 mol% H2 and 50 mol% He. 1.00-L samples of this gas mixture are mixed with variable volumes of O2 (at 0 °C and 1 atm). A spark is introduced to allow the mixture to undergo complete combustion. The final volume is measured at 0 °C and 1 atm. Which graph best depicts the final volume as a function of the volume of added O2? (A) 2.00 1.75 Final Volume, L 1.50 1.25 1.00 0.75 0.50 0.25 0.00 0.00 0.25 0.50 2.00 (B) 1.75 1.50 Final Volume, L 1.25 1.00 0.75 0.50- 0.25 0.00 0.75 1.00 0.00 0.25 Volume O₂ added, L 2 0.50 0.75 1.00 Volume O₂ added, L 2 2.00 2.00 (C) (D) 1.75 1.75 1.50 1.50 Final Volume, L 1.25 1.00 0.75 0.50 Final Volume, L 1.25 1.00 0.75 0.50 0.25 0.25 0.00 0.00 0.00 0.25 0.50 0.75 1.00 0.00 0.25 Volume O₂ added, L 0.50 0.75 1.00 Volume O₂ added, L 2arrow_forward
 ChemistryChemistryISBN:9781305957404Author:Steven S. Zumdahl, Susan A. Zumdahl, Donald J. DeCostePublisher:Cengage Learning
 ChemistryChemistryISBN:9781259911156Author:Raymond Chang Dr., Jason Overby ProfessorPublisher:McGraw-Hill Education
 Principles of Instrumental AnalysisChemistryISBN:9781305577213Author:Douglas A. Skoog, F. James Holler, Stanley R. CrouchPublisher:Cengage Learning
 Organic ChemistryChemistryISBN:9780078021558Author:Janice Gorzynski Smith Dr.Publisher:McGraw-Hill Education
 Chemistry: Principles and ReactionsChemistryISBN:9781305079373Author:William L. Masterton, Cecile N. HurleyPublisher:Cengage Learning
 Elementary Principles of Chemical Processes, Bind...ChemistryISBN:9781118431221Author:Richard M. Felder, Ronald W. Rousseau, Lisa G. BullardPublisher:WILEY