
(a)
Interpretation:
The graph of diffusion coefficient (D) m2/s, v/s inverse of temperature (1/T) needs to be plotted using the given data.
Concept Introduction:
Diffusion coefficient (D) is given by the following relation:
Where,
Answer to Problem 5.44P
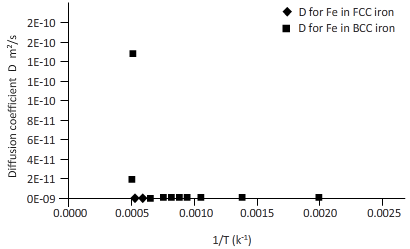
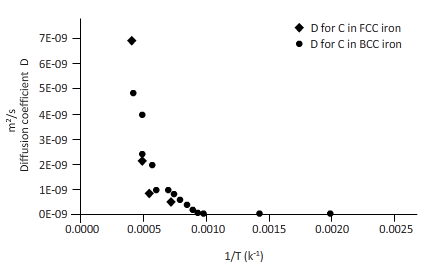
The curves between diffusion coefficient and inverse temperature for Fe atom in FCC and BCC iron are as follows:


Explanation of Solution
Given Information:
| Diffusion couple | Diffusion | Q(J/mol) | Do(m2/s) |
| C in FCC iron | Interstitial | ||
| C in BCC iron | Interstitial | ||
| Fe in FCC iron | vacancy | ||
| Fe in BCC iron | vacancy |
Calculation:
The diffusion coefficient can be calculated as follows:
Here,
Equation (1) becomes
Hence, coefficient of diffusion for C in FCC iron at
Now, draw a table to calculate the coefficient of diffusion for C in FCC iron and for C in BCC iron diffusion temperature.
| T(k) | 1/T(k-1) | D for C in FCC iron ( | D for C in BCC iron ( |
| 2000 | 0.0005 | 6E-09 | 6E-09 |
| 1750 | 0.0006 | 2E-09 | 3E-09 |
| 1500 | 0.0007 | 4E-10 | 1E-09 |
| 1250 | 0.0008 | 4E-11 | 2E-10 |
| 1200 | 0.0008 | 2E-11 | 2E-10 |
| 1150 | 0.0009 | 1E-11 | 1E-10 |
| 1100 | 0.0009 | 7E-12 | 8E-11 |
| 1000 | 0.0010 | 1E-12 | 3E-11 |
| 750 | 0.0013 | 6E-15 | 9E-13 |
| 500 | 0.0020 | 9E-20 | 8E-16 |
From the table, plot a curve between inverse temperature (1/T) and diffusion coefficient D.

Again draw a table to calculate the coefficient of diffusion for Fe in FCC iron and for Fe in BCC iron at different temperature.
| T(k) | 1/k(k-1) | D for C in FCC iron ( | D for C in BCC iron ( |
| 2000 | 0.0005 | 3E-12 | 2E-10 |
| 1750 | 0.0006 | 3E-13 | 2E-11 |
| 1500 | 0.0007 | 1E-14 | 1E-12 |
| 1250 | 0.0008 | 1E-16 | 2E-14 |
| 1200 | 0.0008 | 5E-17 | 8E-15 |
| 1150 | 0.0009 | 1E-17 | 3E-15 |
| 1100 | 0.0009 | 4E-18 | 9E-16 |
| 1000 | 0.0010 | 2E-19 | 6E-17 |
| 750 | 0.0013 | 2E-24 | 3E-21 |
| 500 | 0.0020 | 5E-34 | 9E-30 |
Plotting the curve between inverse temperature (1/T) and diffusion coefficient (D) for Fe atom in FCC and BCC.
(b)
Interpretation:
The temperature range at which the iron-transition takes place needs to be determined from the graphs.
Concept Introduction:
Iron transition is the period in which a subject change from one state to another takes place.
Answer to Problem 5.44P
The iron transition for BCC to FCC takes place in a range of temperature 1150 K-1200 K.
The iron transition for FCC to BCC takes place in the range of 1600 K-1700 K.
Explanation of Solution
Given Information:
| Diffusion couple | Diffusion mechanism | Q(J/mol) | Do(m2/s) |
| C in FCC iron | Interstitial | ||
| C in BCC iron | Interstitial | ||
| Fe in FCC iron | vacancy | ||
| Fe in BCC iron | vacancy |
The curves between diffusion coefficient and inverse temperature for Fe atom in FCC and BCC iron are as follows:

From the curve (1),
BCC iron to FCC iron transition takes place in a range of temperature 1150 K-1200 K.
From the curve (2),the iron transition from BCC to FCC iron take place in the temperature range 1600 K-1700 K.
(c)
Interpretation:
The reason for the higher activation energy for diffusion in FCC iron than carbon needs to be explained.
Concept Introduction:
Activation energy, D is related to the size of the atom.
Answer to Problem 5.44P
An atomic number of carbon (C) is 6 while the atomic number of iron (Fe) is 26.
As we know that activation is related to the size of atom hence more atomic number greater is the activation energy required.
Explanation of Solution
Diffusion atom is placed in a vacancy position.
But in some atoms, there is a defect due to more interstitial position and less vacancy. Diffusion atom takes less time to reach in interstitial position than vacancy. Activation energy co-relates with atomic number. Hence, more atomic number, maximum activation energy is required. The atomic number of carbon is 4 and that of iron is 26. Thus, the activation energy for diffusion of Fe is higher than that of C.
(d)
Interpretation:
The reason for the higher activation energy for the diffusion of FCC than BCC iron needs to be explained.
Concept Introduction:
Activation energy is directly proportional to the packing fraction. Packing fraction is a bond formed by atoms.
Answer to Problem 5.44P
Packing fraction of FCC structure is 0.71 while that for the BCC structure is 0.68.
Hence, the activation energy required for FCC is more than BCC.
Explanation of Solution
Packing fraction is the measurement of loss or gain of the total mass in a group of the nucleus which directly relates atomic bond. Packing fraction is correlated with activation energy. The packing fraction for FCC structure is 0.74 and that for the BCC structure is 0.68.
The activation energy for diffusion higher in FCC as compared to the BCC iron.
(e)
Interpretation:
Whether the diffusion rate in FCC is faster than in BCC or not needs to be determined.
Concept Introduction:
Diffusion coefficient (D) is given by the following relation:
Where,
Answer to Problem 5.44P
Diffusion rate in FCC structure is slower than the BCC structure.
Explanation of Solution
Taking T= 1175 K from temperature range of BCC to FCC iron transition.
Since,
Substitute,
Equation (1) becomes,
Again to find out 'D' in BCC iron for carbon.
Put
Equation (1) becomes,
From (a) and (b), one can say that the diffusion coefficient is more in BCC structure than the FCC.
Hence, diffusion atoms move faster in BCC structure compared to FCC structure.
Want to see more full solutions like this?
Chapter 5 Solutions
Essentials Of Materials Science And Engineering

- ##2# Superheated steam powers a steam turbine for the production of electrical energy. The steam expands in the turbine and at an intermediate expansion pressure (0.1 Mpa) a fraction is extracted for a regeneration process in a surface regenerator. The turbine has an isentropic efficiency of 90% Design the simplified power plant schematic Analyze it on the basis of the attached figure Determine the power generated and the thermal efficiency of the plant ### Dados in the attached imagesarrow_forwardProblem 1 (A, C and D are pins) Find the reactions and A, C and D. D 6 m B 12 kN/m 8 m A C 6 marrow_forwardUniform Grade of Pipe Station of Point A is 9+50.00. Elevation Point A = 250.75.Station of Point B is 13+75.00. Elevation Point B = 244.10 1) Calculate flowline of pipe elevations at every 50 ft. interval (Half Station). 2) Tabulate station and elevation for each station like shown on example 3) Draw Sketcharrow_forward
- ### To make a conclusion for a report of an experiment on rockets, in which the openrocket software was used for the construction and modeling of two rockets: one one-stage and one two-stage. First rocket (single-stage) reached a maximum vertical speed of 100 m/s and a maximum height of 500 m The second rocket (two-stage) reached a maximum vertical speed of 50 m/s and a maximum height of 250 m To make a simplified conclusion, taking into account the efficiency of the software in the study of rocketsarrow_forwardThe images I have uploaded are the part 1 to 4 and questions below are continue on the questions uploaded 5. C++ Class Template with Method Stubs #pragma once #include <iostream> #include <string> #include <stdexcept> #include <vector> template <typename T> class HashTable { private: struct Entry { std::string key; T value; bool isOccupied; bool isDeleted; Entry() : key(""), value(), isOccupied(false), isDeleted(false) {} }; Entry* table; size_t capacity; size_t size; double loadFactorThreshold; size_t customHash(const std::string& key) const { size_t hash = 5381; for (char c : key) { hash = ((hash << 5) + hash) + c; } return hash; } size_t probe(const std::string& key, bool forInsert = false) const; void resize(); public: // Constructor HashTable(size_t initialCapacity = 101); // Big…arrow_forwardDetermine the coefficients of polynomial for the polynomial function of Cam profile based on the boundary conditions shown in the figure. S a 3 4 5 C₁ (+) Ꮎ В s = q + q { + c f * + q € * + q ( +c+c+c 6 Ꮎ +C5 +C β В В 0 cam angle 0 B 7 (arrow_forward
- ### Superheated steam powers a steam turbine for the production of electrical energy. The steam expands in the turbine and at an intermediate expansion pressure (0.1 Mpa) a fraction is extracted for a regeneration process in a surface regenerator. The turbine has an isentropic efficiency of 90% Design the simplified power plant schematic Analyze it on the basis of the attached figure Determine the power generated and the thermal efficiency of the plant ### Dados in the attached imagesarrow_forwardThe machine below forms metal plates through the application of force. Two toggles (ABC and DEF) transfer forces from the central hydraulic cylinder (H) to the plates that will be formed. The toggles then push bar G to the right, which then presses a plate (p) into the cavity, thus shaping it. In this case, the plate becomes a section of a sphere. If the hydraulic cylinder can produce a maximum force of F = 10 kN, then what is the maximum P value (i.e. Pmax) that can be applied to the plate when θ = 35°? Also, what are the compressive forces in the toggle rods in that situation? Finally, what happens to Pmax and the forces in the rods as θ decreases in magnitude?arrow_forwardAnswer all the questions What is the minimum value of capacitor C1 required such that Vfiltered does not drop below 8 V? Use the design equation(but make sure you use the right “frequency” and the correct ripple voltage). Show your calculations. Display your circuit in circuit js. Display Vsecondary (can use the voltage across the added 100 kΩ resistor) and Vfiltered in a “Combined Scope”. Display VDC in a separate scope: a) Turn on “Max Scale”, “Show Peak Value” and “Show Negative Peak Value”: b) Run the simulator and adjust the window and simulation speed and time step to be able to see a couple of cycles. Include a screen capture Document the minimum and maximum values for Vfiltered in your lab report. Is Vfiltered maintained to be above 8 V? By how much? Why? Explain the waveform shape captured Vfiltered. It may help your understanding to rerun the simulation with C1 removed and compare that waveform for Vfiltered to that capturedarrow_forward
- 40m 150N B 40marrow_forwardthis project is NOT for graded(marks) purposes, please help me with the introduction. give me answers for the project. i will include an image explaining everything about the project.arrow_forwardDetermine the magnitude of the minimum force P needed to prevent the 20 kg uniform rod AB from sliding. The contact surface at A is smooth, whereas the coefficient of static friction between the rod and the floor is μs = 0.3.arrow_forward
 MATLAB: An Introduction with ApplicationsEngineeringISBN:9781119256830Author:Amos GilatPublisher:John Wiley & Sons Inc
 Essentials Of Materials Science And EngineeringEngineeringISBN:9781337385497Author:WRIGHT, Wendelin J.Publisher:Cengage,
 Industrial Motor ControlEngineeringISBN:9781133691808Author:Stephen HermanPublisher:Cengage Learning
 Basics Of Engineering EconomyEngineeringISBN:9780073376356Author:Leland Blank, Anthony TarquinPublisher:MCGRAW-HILL HIGHER EDUCATION
 Structural Steel Design (6th Edition)EngineeringISBN:9780134589657Author:Jack C. McCormac, Stephen F. CsernakPublisher:PEARSON
 Fundamentals of Materials Science and Engineering...EngineeringISBN:9781119175483Author:William D. Callister Jr., David G. RethwischPublisher:WILEY