
Stats: Modeling the World Nasta Edition Grades 9-12
3rd Edition
ISBN: 9780131359581
Author: David E. Bock, Paul F. Velleman, Richard D. De Veaux
Publisher: PEARSON
expand_more
expand_more
format_list_bulleted
Concept explainers
Videos
Question
Chapter 5, Problem 26E
a)
To determine
To create a parallel boxplot.
a)
Expert Solution
Explanation of Solution
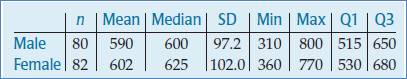
Given:
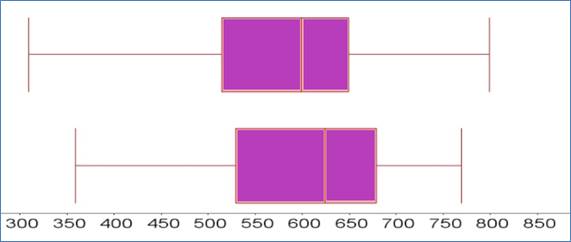
Following is the parallel boxplot:
b)
To determine
To explain the result of boxplot.
b)
Expert Solution
Explanation of Solution
Given:


The shape of the distributions of Male and Female are right skewed. The center of the Females scores is higher than the center of the Male scores. The spread of the Female scores is less than the spread of the Male scores.
Chapter 5 Solutions
Stats: Modeling the World Nasta Edition Grades 9-12
Ch. 5 - Prob. 1ECh. 5 - Prob. 5ECh. 5 - Prob. 6ECh. 5 - Prob. 7ECh. 5 - Prob. 8ECh. 5 - Prob. 9ECh. 5 - Prob. 10ECh. 5 - Prob. 11ECh. 5 - Prob. 12ECh. 5 - Prob. 13E
Ch. 5 - Prob. 14ECh. 5 - Prob. 15ECh. 5 - Prob. 16ECh. 5 - Prob. 17ECh. 5 - Prob. 18ECh. 5 - Prob. 19ECh. 5 - Prob. 20ECh. 5 - Prob. 21ECh. 5 - Prob. 22ECh. 5 - Prob. 23ECh. 5 - Prob. 24ECh. 5 - Prob. 25ECh. 5 - Prob. 26ECh. 5 - Prob. 27ECh. 5 - Prob. 28ECh. 5 - Prob. 29ECh. 5 - Prob. 30ECh. 5 - Prob. 31ECh. 5 - Prob. 32ECh. 5 - Prob. 33ECh. 5 - Prob. 34ECh. 5 - Prob. 35ECh. 5 - Prob. 36ECh. 5 - Prob. 37ECh. 5 - Prob. 38ECh. 5 - Prob. 39ECh. 5 - Prob. 40ECh. 5 - Prob. 41ECh. 5 - Prob. 42E
Additional Math Textbook Solutions
Find more solutions based on key concepts
A categorical variable has three categories, with the following frequencies of occurrence: a. Compute the perce...
Basic Business Statistics, Student Value Edition
In Exercises 5-36, express all probabilities as fractions.
23. Combination Lock The typical combination lock us...
Elementary Statistics
In Exercises 25–28, use the confidence interval to find the margin of error and the sample mean.
25. (12.0, 14....
Elementary Statistics: Picturing the World (7th Edition)
Each of Exercises 1–6 gives a formula for the nth term an of a sequence {an}. Find the values of a1 a2, a3 and ...
University Calculus: Early Transcendentals (4th Edition)
Time Employed A human resources manager for a large company takes a random sample of 50 employees from the comp...
Introductory Statistics
Fill in each blank so that the resulting statement is true. If n is a counting number, bn, read ______, indicat...
College Algebra (7th Edition)
Knowledge Booster


Learn more about
Need a deep-dive on the concept behind this application? Look no further. Learn more about this topic, statistics and related others by exploring similar questions and additional content below.Similar questions
- Using the accompanying Home Market Value data and associated regression line, Market ValueMarket Valueequals=$28,416+$37.066×Square Feet, compute the errors associated with each observation using the formula e Subscript ieiequals=Upper Y Subscript iYiminus−ModifyingAbove Upper Y with caret Subscript iYi and construct a frequency distribution and histogram. LOADING... Click the icon to view the Home Market Value data. Question content area bottom Part 1 Construct a frequency distribution of the errors, e Subscript iei. (Type whole numbers.) Error Frequency minus−15 comma 00015,000less than< e Subscript iei less than or equals≤minus−10 comma 00010,000 0 minus−10 comma 00010,000less than< e Subscript iei less than or equals≤minus−50005000 5 minus−50005000less than< e Subscript iei less than or equals≤0 21 0less than< e Subscript iei less than or equals≤50005000 9…arrow_forwardThe managing director of a consulting group has the accompanying monthly data on total overhead costs and professional labor hours to bill to clients. Complete parts a through c Overhead Costs Billable Hours345000 3000385000 4000410000 5000462000 6000530000 7000545000 8000arrow_forwardUsing the accompanying Home Market Value data and associated regression line, Market ValueMarket Valueequals=$28,416plus+$37.066×Square Feet, compute the errors associated with each observation using the formula e Subscript ieiequals=Upper Y Subscript iYiminus−ModifyingAbove Upper Y with caret Subscript iYi and construct a frequency distribution and histogram. Square Feet Market Value1813 911001916 1043001842 934001814 909001836 1020002030 1085001731 877001852 960001793 893001665 884001852 1009001619 967001690 876002370 1139002373 1131001666 875002122 1161001619 946001729 863001667 871001522 833001484 798001589 814001600 871001484 825001483 787001522 877001703 942001485 820001468 881001519 882001518 885001483 765001522 844001668 909001587 810001782 912001483 812001519 1007001522 872001684 966001581 86200arrow_forward
- For a binary asymmetric channel with Py|X(0|1) = 0.1 and Py|X(1|0) = 0.2; PX(0) = 0.4 isthe probability of a bit of “0” being transmitted. X is the transmitted digit, and Y is the received digit.a. Find the values of Py(0) and Py(1).b. What is the probability that only 0s will be received for a sequence of 10 digits transmitted?c. What is the probability that 8 1s and 2 0s will be received for the same sequence of 10 digits?d. What is the probability that at least 5 0s will be received for the same sequence of 10 digits?arrow_forwardV2 360 Step down + I₁ = I2 10KVA 120V 10KVA 1₂ = 360-120 or 2nd Ratio's V₂ m 120 Ratio= 360 √2 H I2 I, + I2 120arrow_forwardQ2. [20 points] An amplitude X of a Gaussian signal x(t) has a mean value of 2 and an RMS value of √(10), i.e. square root of 10. Determine the PDF of x(t).arrow_forward
- In a network with 12 links, one of the links has failed. The failed link is randomlylocated. An electrical engineer tests the links one by one until the failed link is found.a. What is the probability that the engineer will find the failed link in the first test?b. What is the probability that the engineer will find the failed link in five tests?Note: You should assume that for Part b, the five tests are done consecutively.arrow_forwardProblem 3. Pricing a multi-stock option the Margrabe formula The purpose of this problem is to price a swap option in a 2-stock model, similarly as what we did in the example in the lectures. We consider a two-dimensional Brownian motion given by W₁ = (W(¹), W(2)) on a probability space (Q, F,P). Two stock prices are modeled by the following equations: dX = dY₁ = X₁ (rdt+ rdt+0₁dW!) (²)), Y₁ (rdt+dW+0zdW!"), with Xo xo and Yo =yo. This corresponds to the multi-stock model studied in class, but with notation (X+, Y₁) instead of (S(1), S(2)). Given the model above, the measure P is already the risk-neutral measure (Both stocks have rate of return r). We write σ = 0₁+0%. We consider a swap option, which gives you the right, at time T, to exchange one share of X for one share of Y. That is, the option has payoff F=(Yr-XT). (a) We first assume that r = 0 (for questions (a)-(f)). Write an explicit expression for the process Xt. Reminder before proceeding to question (b): Girsanov's theorem…arrow_forwardProblem 1. Multi-stock model We consider a 2-stock model similar to the one studied in class. Namely, we consider = S(1) S(2) = S(¹) exp (σ1B(1) + (M1 - 0/1 ) S(²) exp (02B(2) + (H₂- M2 where (B(¹) ) +20 and (B(2) ) +≥o are two Brownian motions, with t≥0 Cov (B(¹), B(2)) = p min{t, s}. " The purpose of this problem is to prove that there indeed exists a 2-dimensional Brownian motion (W+)+20 (W(1), W(2))+20 such that = S(1) S(2) = = S(¹) exp (011W(¹) + (μ₁ - 01/1) t) 롱) S(²) exp (021W (1) + 022W(2) + (112 - 03/01/12) t). where σ11, 21, 22 are constants to be determined (as functions of σ1, σ2, p). Hint: The constants will follow the formulas developed in the lectures. (a) To show existence of (Ŵ+), first write the expression for both W. (¹) and W (2) functions of (B(1), B(²)). as (b) Using the formulas obtained in (a), show that the process (WA) is actually a 2- dimensional standard Brownian motion (i.e. show that each component is normal, with mean 0, variance t, and that their…arrow_forward
arrow_back_ios
SEE MORE QUESTIONS
arrow_forward_ios
Recommended textbooks for you
 MATLAB: An Introduction with ApplicationsStatisticsISBN:9781119256830Author:Amos GilatPublisher:John Wiley & Sons Inc
 Probability and Statistics for Engineering and th...StatisticsISBN:9781305251809Author:Jay L. DevorePublisher:Cengage Learning
 Statistics for The Behavioral Sciences (MindTap C...StatisticsISBN:9781305504912Author:Frederick J Gravetter, Larry B. WallnauPublisher:Cengage Learning
 Elementary Statistics: Picturing the World (7th E...StatisticsISBN:9780134683416Author:Ron Larson, Betsy FarberPublisher:PEARSON
 The Basic Practice of StatisticsStatisticsISBN:9781319042578Author:David S. Moore, William I. Notz, Michael A. FlignerPublisher:W. H. Freeman
 Introduction to the Practice of StatisticsStatisticsISBN:9781319013387Author:David S. Moore, George P. McCabe, Bruce A. CraigPublisher:W. H. Freeman
MATLAB: An Introduction with Applications
Statistics
ISBN:9781119256830
Author:Amos Gilat
Publisher:John Wiley & Sons Inc
Probability and Statistics for Engineering and th...
Statistics
ISBN:9781305251809
Author:Jay L. Devore
Publisher:Cengage Learning
Statistics for The Behavioral Sciences (MindTap C...
Statistics
ISBN:9781305504912
Author:Frederick J Gravetter, Larry B. Wallnau
Publisher:Cengage Learning
Elementary Statistics: Picturing the World (7th E...
Statistics
ISBN:9780134683416
Author:Ron Larson, Betsy Farber
Publisher:PEARSON
The Basic Practice of Statistics
Statistics
ISBN:9781319042578
Author:David S. Moore, William I. Notz, Michael A. Fligner
Publisher:W. H. Freeman
Introduction to the Practice of Statistics
Statistics
ISBN:9781319013387
Author:David S. Moore, George P. McCabe, Bruce A. Craig
Publisher:W. H. Freeman
Points, Lines, Planes, Segments, & Rays - Collinear vs Coplanar Points - Geometry; Author: The Organic Chemistry Tutor;https://www.youtube.com/watch?v=dDWjhRfBsKM;License: Standard YouTube License, CC-BY
Naming Points, Lines, and Planes; Author: Florida PASS Program;https://www.youtube.com/watch?v=F-LxiLSSaLg;License: Standard YouTube License, CC-BY