
Videos
a)
To explain the shape of the distribution.
a)
Answer to Problem 10E
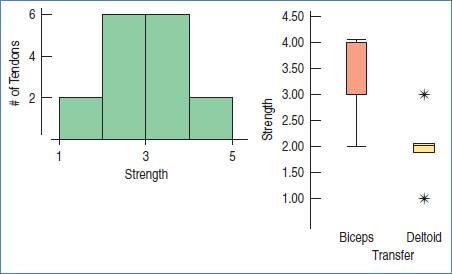
Symmetric.
Explanation of Solution
Given:

Calculation:
The shape of the distribution is symmetric.
b)
To find rang of the strength scores.
b)
Answer to Problem 10E
The
Explanation of Solution
Given:
Calculation:
We know, range is the difference between highest and lowest values.
c)
To explain the hidden facts.
c)
Answer to Problem 10E
We don’t know the number of results produced by each procedure done.
Explanation of Solution
Given:

Calculation:
From histogram, we don’t know the number of results produced by each procedure done. Therefore, it shows fairly low variations from the mean. This fact is hidden in Histogram.
d)
To explain which method had higher
d)
Answer to Problem 10E
Biceps.
Explanation of Solution
Given:

Using boxplot, the higher median shows for the biceps transfer method as compare to Deltoid transfer method.
e)
To explain whether Biceps transfer method is always best.
e)
Answer to Problem 10E
No.
Explanation of Solution
Given:

The lower IQR and highest outliers of Deltoid can be best for sometimes. Hence, Deltoid is not always best method.
f)
To explain which method produces most consistent results.
f)
Answer to Problem 10E
Deltoid.
Explanation of Solution
Given:

The lower IQRof Deltoid deal as consistent results as compare to Biceps.
Chapter 5 Solutions
Stats: Modeling the World Nasta Edition Grades 9-12
Additional Math Textbook Solutions
Elementary Statistics: Picturing the World (7th Edition)
University Calculus: Early Transcendentals (4th Edition)
Elementary Statistics
College Algebra with Modeling & Visualization (5th Edition)
College Algebra (7th Edition)
Elementary Statistics (13th Edition)


- Please help me with this statistics questionarrow_forwardPlease help me with the following statistic questionarrow_forwardTo evaluate the success of a 1-year experimental program designed to increase the mathematical achievement of underprivileged high school seniors, a random sample of participants in the program will be selected and their mathematics scores will be compared with the previous year’s statewide average of 525 for underprivileged seniors. The researchers want to determine whether the experimental program has increased the mean achievement level over the previous year’s statewide average. If alpha=.05, what sample size is needed to have a probability of Type II error of at most .025 if the actual mean is increased to 550? From previous results, sigma=80.arrow_forward
- Please help me answer the following questions from this problem.arrow_forwardPlease help me find the sample variance for this question.arrow_forwardCrumbs Cookies was interested in seeing if there was an association between cookie flavor and whether or not there was frosting. Given are the results of the last week's orders. Frosting No Frosting Total Sugar Cookie 50 Red Velvet 66 136 Chocolate Chip 58 Total 220 400 Which category has the greatest joint frequency? Chocolate chip cookies with frosting Sugar cookies with no frosting Chocolate chip cookies Cookies with frostingarrow_forward
- The table given shows the length, in feet, of dolphins at an aquarium. 7 15 10 18 18 15 9 22 Are there any outliers in the data? There is an outlier at 22 feet. There is an outlier at 7 feet. There are outliers at 7 and 22 feet. There are no outliers.arrow_forwardStart by summarizing the key events in a clear and persuasive manner on the article Endrikat, J., Guenther, T. W., & Titus, R. (2020). Consequences of Strategic Performance Measurement Systems: A Meta-Analytic Review. Journal of Management Accounting Research?arrow_forwardThe table below was compiled for a middle school from the 2003 English/Language Arts PACT exam. Grade 6 7 8 Below Basic 60 62 76 Basic 87 134 140 Proficient 87 102 100 Advanced 42 24 21 Partition the likelihood ratio test statistic into 6 independent 1 df components. What conclusions can you draw from these components?arrow_forward
- What is the value of the maximum likelihood estimate, θ, of θ based on these data? Justify your answer. What does the value of θ suggest about the value of θ for this biased die compared with the value of θ associated with a fair, unbiased, die?arrow_forwardShow that L′(θ) = Cθ394(1 −2θ)604(395 −2000θ).arrow_forwarda) Let X and Y be independent random variables both with the same mean µ=0. Define a new random variable W = aX +bY, where a and b are constants. (i) Obtain an expression for E(W).arrow_forward
 MATLAB: An Introduction with ApplicationsStatisticsISBN:9781119256830Author:Amos GilatPublisher:John Wiley & Sons Inc
 Probability and Statistics for Engineering and th...StatisticsISBN:9781305251809Author:Jay L. DevorePublisher:Cengage Learning
 Statistics for The Behavioral Sciences (MindTap C...StatisticsISBN:9781305504912Author:Frederick J Gravetter, Larry B. WallnauPublisher:Cengage Learning
 Elementary Statistics: Picturing the World (7th E...StatisticsISBN:9780134683416Author:Ron Larson, Betsy FarberPublisher:PEARSON
 The Basic Practice of StatisticsStatisticsISBN:9781319042578Author:David S. Moore, William I. Notz, Michael A. FlignerPublisher:W. H. Freeman
 Introduction to the Practice of StatisticsStatisticsISBN:9781319013387Author:David S. Moore, George P. McCabe, Bruce A. CraigPublisher:W. H. Freeman