Gender Discrimination in Tech (Example 6) A Pew Research poll asked respondents to fill in the blank to this question: Compared to other industries there is _____ discrimination against women in the tech industry. Responses separated by gender are shown in the following table. The results are shown using a sample size of 280 men and 150 women. (Source: Pewresearch.org) See page 263 for guidance. a. If a person is selected at random from this group, find the probability that the person is a man or said “about the same” (or both)? b. If a person is selected at random from this group, find the probability the person is a man and said “about the same.”
Gender Discrimination in Tech (Example 6) A Pew Research poll asked respondents to fill in the blank to this question: Compared to other industries there is _____ discrimination against women in the tech industry. Responses separated by gender are shown in the following table. The results are shown using a sample size of 280 men and 150 women. (Source: Pewresearch.org) See page 263 for guidance. a. If a person is selected at random from this group, find the probability that the person is a man or said “about the same” (or both)? b. If a person is selected at random from this group, find the probability the person is a man and said “about the same.”
Solution Summary: The provided table summarizes the result of a Pew Research poll in which respondents were asked to fill in the blank to the question on Gender discrimination in Tech industry.
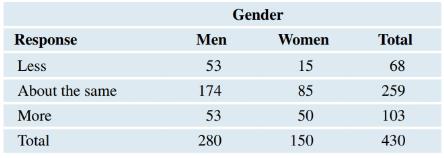
Gender Discrimination in Tech (Example 6) A Pew Research poll asked respondents to fill in the blank to this question: Compared to other industries there is _____ discrimination against women in the tech industry. Responses separated by gender are shown in the following table. The results are shown using a sample size of 280 men and 150 women. (Source: Pewresearch.org) See page 263 for guidance.
a. If a person is selected at random from this group, find the probability that the person is a man or said “about the same” (or both)?
b. If a person is selected at random from this group, find the probability the person is a man and said “about the same.”
Definition Definition Number of subjects or observations included in a study. A large sample size typically provides more reliable results and better representation of the population. As sample size and width of confidence interval are inversely related, if the sample size is increased, the width of the confidence interval decreases.
NC Current Students - North Ce X | NC Canvas Login Links - North ( X
Final Exam Comprehensive x Cengage Learning
x
WASTAT - Final Exam - STAT
→
C
webassign.net/web/Student/Assignment-Responses/submit?dep=36055360&tags=autosave#question3659890_9
Part (b)
Draw a scatter plot of the ordered pairs.
N
Life
Expectancy
Life
Expectancy
80
70
600
50
40
30
20
10
Year of
1950
1970 1990
2010 Birth
O
Life
Expectancy
Part (c)
800
70
60
50
40
30
20
10
1950
1970 1990
W
ALT
林
$
#
4
R
J7
Year of
2010 Birth
F6
4+
80
70
60
50
40
30
20
10
Year of
1950 1970 1990
2010 Birth
Life
Expectancy
Ox
800
70
60
50
40
30
20
10
Year of
1950 1970 1990 2010 Birth
hp
P.B.
KA
&
7
80
% 5
H
A
B
F10
711
N
M
K
744
PRT SC
ALT
CTRL
Harvard University
California Institute of Technology
Massachusetts Institute of Technology
Stanford University
Princeton University
University of Cambridge
University of Oxford
University of California, Berkeley
Imperial College London
Yale University
University of California, Los Angeles
University of Chicago
Johns Hopkins University
Cornell University
ETH Zurich
University of Michigan
University of Toronto
Columbia University
University of Pennsylvania
Carnegie Mellon University
University of Hong Kong
University College London
University of Washington
Duke University
Northwestern University
University of Tokyo
Georgia Institute of Technology
Pohang University of Science and Technology
University of California, Santa Barbara
University of British Columbia
University of North Carolina at Chapel Hill
University of California, San Diego
University of Illinois at Urbana-Champaign
National University of Singapore
McGill…
Chapter 5 Solutions
Pearson eText Introductory Statistics: Exploring the World Through Data -- Instant Access (Pearson+)
Need a deep-dive on the concept behind this application? Look no further. Learn more about this topic, statistics and related others by exploring similar questions and additional content below.


 Holt Mcdougal Larson Pre-algebra: Student Edition...AlgebraISBN:9780547587776Author:HOLT MCDOUGALPublisher:HOLT MCDOUGAL
 Glencoe Algebra 1, Student Edition, 9780079039897...AlgebraISBN:9780079039897Author:CarterPublisher:McGraw Hill
 Big Ideas Math A Bridge To Success Algebra 1: Stu...AlgebraISBN:9781680331141Author:HOUGHTON MIFFLIN HARCOURTPublisher:Houghton Mifflin Harcourt
 College Algebra (MindTap Course List)AlgebraISBN:9781305652231Author:R. David Gustafson, Jeff HughesPublisher:Cengage Learning