
Concept explainers
Videos
To analyze:
The result and describe the pathway that is followed by the protein by plotting a fluorescence intensity versus time graph with the help of the given table.
Given:
The green fluorescent protein (GFP) gene is fused with the gene of the viral protein. The normal cell is infected and the movement of the protein is monitored using fluorescence imaging equipment. The table shown below summarizes the result of the experiment:
| Relative fluorescence intensity | ||||
| Time (minutes) | Endoplasmic reticulum (ER) | Golgi | Cell membrane | Total |
| 0 | 0.95 | 0.05 | 0.00 | 1.00 |
| 20 | 0.64 | 0.28 | 0.08 | 1.00 |
| 40 | 0.38 | 0.39 | 0.23 | 1.00 |
| 60 | 0.17 | 0.38 | 0.44 | 0.99 |
| 80 | 0.05 | 0.28 | 0.65 | 0.98 |
| 100 | 0.00 | 0.25 | 0.70 | 0.95 |
| 150 | 0.00 | 0.05 | 0.77 | 0.82 |
| 200 | 0.00 | 0.00 | 0.75 | 0.75 |
Introduction:
The GFP is a protein that fluoresces and is obtained from the aquatic animal called jellyfish, having the scientific name Aequorea victoria. It is made up of 238 amino acids. It emits green fluorescent light in the presence of ultraviolet light. GFP is used widely in biological techniques. For example, GFP gene is fused with the gene of the viral protein. The normal cell is then infected and the movement of the protein is monitored using fluorescence imaging equipment. This method is used to track the pathway that is traced by the protein.
Explanation of Solution
The graph of fluorescence intensity against time for the protein that is present in the ER is given below:
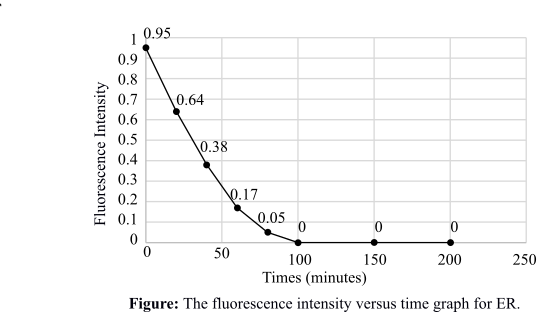
This graph depicts the intensity of fluorescence against time for the protein that is present in the ER. Initially, the fluorescence intensity is high, which means that the protein is entering the ER directly after synthesis. The graph plot is gradually decreasing, which is showing that the fluorescence in the ER is decreasing and reaching zero. This means that the fluorescent protein has moved out of the ER.
The graph of fluorescence intensity against time for the protein that is present in the Golgi apparatus is given below:
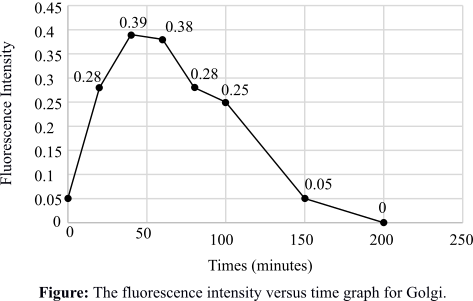
This graph depicts the intensity of fluorescence against time for the protein that is present in the Golgi apparatus. Initially, the fluorescence intensity is increasing, which means that the protein is entering the Golgi after a considerable time. The graph plot is gradually decreasing, which is showing that the fluorescence in the Golgi is decreasing and reaching zero. This means that the fluorescent protein is also moving out of the Golgi.
The graph of fluorescence intensity against time for the protein that is present in the cell membrane is given below:
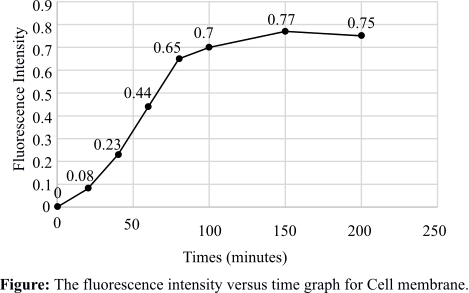
This graph depicts the intensity of fluorescence against time for the protein that is present in the cell membrane. The fluorescence intensity is increasing gradually and is maximized after some time, which means that the protein is embedded in the cell membrane.
The pathway that is followed by the protein is traced with the help of the graphs drawn. The protein enters the ER quickly after synthesis and then goes to the Golgi. From the Golgi, it moves to the cell membrane to form virus particles.
Therefore, the graphs are plotted and the pathway of the GFP fusion protein is traced with the help of the graphs. The pathway followed by the protein is from ER to Golgi and then to the cell membrane.
Want to see more full solutions like this?
Chapter 5 Solutions
LIFE:SCIENCE OF BIOL.(LL) >CUSTOM<


- What did the Cre-lox system used in the Kikuchi et al. 2010 heart regeneration experiment allow researchers to investigate? What was the purpose of the cmlc2 promoter? What is CreER and why was it used in this experiment? If constitutively active Cre was driven by the cmlc2 promoter, rather than an inducible CreER system, what color would you expect new cardiomyocytes in the regenerated area to be no matter what? Why?arrow_forwardWhat kind of organ size regulation is occurring when you graft multiple organs into a mouse and the graft weight stays the same?arrow_forwardWhat is the concept "calories consumed must equal calories burned" in regrads to nutrition?arrow_forward
- You intend to insert patched dominant negative DNA into the left half of the neural tube of a chick. 1) Which side of the neural tube would you put the positive electrode to ensure that the DNA ends up on the left side? 2) What would be the internal (within the embryo) control for this experiment? 3) How can you be sure that the electroporation method itself is not impacting the embryo? 4) What would you do to ensure that the electroporation is working? How can you tell?arrow_forwardDescribe a method to document the diffusion path and gradient of Sonic Hedgehog through the chicken embryo. If modifying the protein, what is one thing you have to consider in regards to maintaining the protein’s function?arrow_forwardThe following table is from Kumar et. al. Highly Selective Dopamine D3 Receptor (DR) Antagonists and Partial Agonists Based on Eticlopride and the D3R Crystal Structure: New Leads for Opioid Dependence Treatment. J. Med Chem 2016.arrow_forward
- The following figure is from Caterina et al. The capsaicin receptor: a heat activated ion channel in the pain pathway. Nature, 1997. Black boxes indicate capsaicin, white circles indicate resinferatoxin. You are a chef in a fancy new science-themed restaurant. You have a recipe that calls for 1 teaspoon of resinferatoxin, but you feel uncomfortable serving foods with "toxins" in them. How much capsaicin could you substitute instead?arrow_forwardWhat protein is necessary for packaging acetylcholine into synaptic vesicles?arrow_forward1. Match each vocabulary term to its best descriptor A. affinity B. efficacy C. inert D. mimic E. how drugs move through body F. how drugs bind Kd Bmax Agonist Antagonist Pharmacokinetics Pharmacodynamicsarrow_forward


 Human Heredity: Principles and Issues (MindTap Co...BiologyISBN:9781305251052Author:Michael CummingsPublisher:Cengage Learning