Concept explainers
To analyze:
The result and describe the pathway that is followed by the protein by plotting a fluorescence intensity versus time graph with the help of the given table.
Given:
The green fluorescent protein (GFP) gene is fused with the gene of the viral protein. The normal cell is infected and the movement of the protein is monitored using fluorescence imaging equipment. The table shown below summarizes the result of the experiment:
| Relative fluorescence intensity | ||||
| Time (minutes) | Endoplasmic reticulum (ER) | Golgi | Cell membrane | Total |
| 0 | 0.95 | 0.05 | 0.00 | 1.00 |
| 20 | 0.64 | 0.28 | 0.08 | 1.00 |
| 40 | 0.38 | 0.39 | 0.23 | 1.00 |
| 60 | 0.17 | 0.38 | 0.44 | 0.99 |
| 80 | 0.05 | 0.28 | 0.65 | 0.98 |
| 100 | 0.00 | 0.25 | 0.70 | 0.95 |
| 150 | 0.00 | 0.05 | 0.77 | 0.82 |
| 200 | 0.00 | 0.00 | 0.75 | 0.75 |
Introduction:
The GFP is a protein that fluoresces and is obtained from the aquatic animal called jellyfish, having the scientific name Aequorea victoria. It is made up of 238 amino acids. It emits green fluorescent light in the presence of ultraviolet light. GFP is used widely in biological techniques. For example, GFP gene is fused with the gene of the viral protein. The normal cell is then infected and the movement of the protein is monitored using fluorescence imaging equipment. This method is used to track the pathway that is traced by the protein.
Explanation of Solution
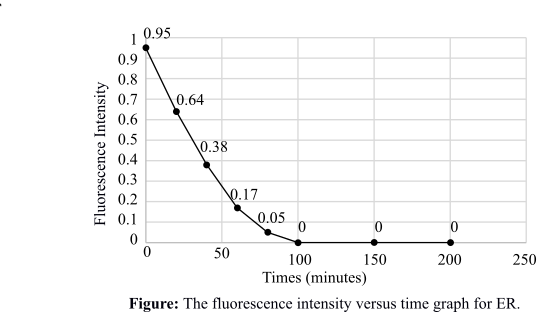
The graph of fluorescence intensity against time for the protein that is present in the ER is given below:

This graph depicts the intensity of fluorescence against time for the protein that is present in the ER. Initially, the fluorescence intensity is high, which means that the protein is entering the ER directly after synthesis. The graph plot is gradually decreasing, which is showing that the fluorescence in the ER is decreasing and reaching zero. This means that the fluorescent protein has moved out of the ER.
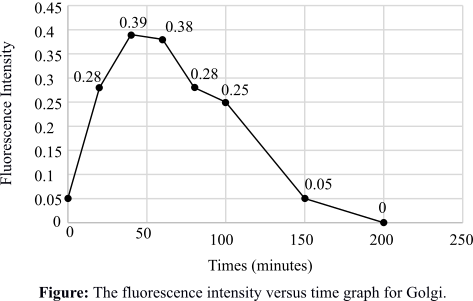
The graph of fluorescence intensity against time for the protein that is present in the Golgi apparatus is given below:

This graph depicts the intensity of fluorescence against time for the protein that is present in the Golgi apparatus. Initially, the fluorescence intensity is increasing, which means that the protein is entering the Golgi after a considerable time. The graph plot is gradually decreasing, which is showing that the fluorescence in the Golgi is decreasing and reaching zero. This means that the fluorescent protein is also moving out of the Golgi.
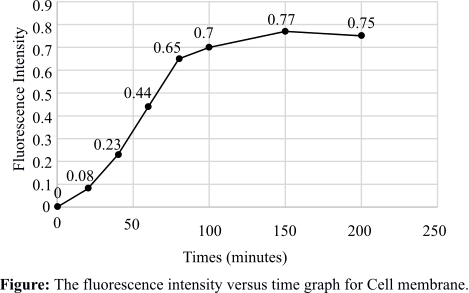
The graph of fluorescence intensity against time for the protein that is present in the cell membrane is given below:

This graph depicts the intensity of fluorescence against time for the protein that is present in the cell membrane. The fluorescence intensity is increasing gradually and is maximized after some time, which means that the protein is embedded in the cell membrane.
The pathway that is followed by the protein is traced with the help of the graphs drawn. The protein enters the ER quickly after synthesis and then goes to the Golgi. From the Golgi, it moves to the cell membrane to form virus particles.
Therefore, the graphs are plotted and the pathway of the GFP fusion protein is traced with the help of the graphs. The pathway followed by the protein is from ER to Golgi and then to the cell membrane.
Want to see more full solutions like this?
Chapter 5 Solutions
EBK LIFE: THE SCIENCE OF BIOLOGY
- 22. Which of the following mutant proteins is expected to have a dominant negative effect when over- expressed in normal cells? a. mutant PI3-kinase that lacks the SH2 domain but retains the kinase function b. mutant Grb2 protein that cannot bind to RTK c. mutant RTK that lacks the extracellular domain d. mutant PDK that has the PH domain but lost the kinase function e. all of the abovearrow_forwardWhat is the label ?arrow_forwardCan you described the image? Can you explain the question as well their answer and how to get to an answer to an problem like this?arrow_forward
- Describe the principle of homeostasis.arrow_forwardExplain how the hormones of the glands listed below travel around the body to target organs and tissues : Pituitary gland Hypothalamus Thyroid Parathyroid Adrenal Pineal Pancreas(islets of langerhans) Gonads (testes and ovaries) Placentaarrow_forwardWhat are the functions of the hormones produced in the glands listed below: Pituitary gland Hypothalamus Thyroid Parathyroid Adrenal Pineal Pancreas(islets of langerhans) Gonads (testes and ovaries) Placentaarrow_forward
- Describe the hormones produced in the glands listed below: Pituitary gland Hypothalamus Thyroid Parathyroid Adrenal Pineal Pancreas(islets of langerhans) Gonads (testes and ovaries) Placentaarrow_forwardPlease help me calculate drug dosage from the following information: Patient weight: 35 pounds, so 15.9 kilograms (got this by dividing 35 pounds by 2.2 kilograms) Drug dose: 0.05mg/kg Drug concentration: 2mg/mLarrow_forwardA 25-year-old woman presents to the emergency department with a 2-day history of fever, chills, severe headache, and confusion. She recently returned from a trip to sub-Saharan Africa, where she did not take malaria prophylaxis. On examination, she is febrile (39.8°C/103.6°F) and hypotensive. Laboratory studies reveal hemoglobin of 8.0 g/dL, platelet count of 50,000/μL, and evidence of hemoglobinuria. A peripheral blood smear shows ring forms and banana-shaped gametocytes. Which of the following Plasmodium species is most likely responsible for her severe symptoms? A. Plasmodium vivax B. Plasmodium ovale C. Plasmodium malariae D. Plasmodium falciparumarrow_forward

 Human Heredity: Principles and Issues (MindTap Co...BiologyISBN:9781305251052Author:Michael CummingsPublisher:Cengage Learning


