The Vintage Restaurant, on Captiva Island near Fort Myers, Florida, is owned and operated by Karen Payne. The restaurant just completed its third year of operation. During those three years, Karen sought to establish a reputation for the restaurant as a high-quality dining establishment that specializes in fresh seafood. Through the efforts of Karen and her staff, her restaurant has become one of the best and fastest-growing restaurants on the island.
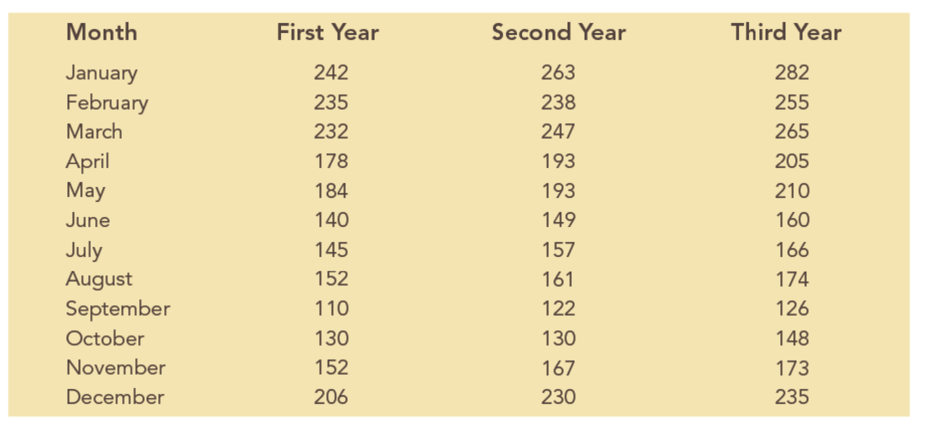
To better plan for future growth of the restaurant, Karen needs to develop a system that will enable her to forecast food and beverage sales by month for up to one year in advance. The following table shows the value of food and beverage sales ($1,000s) for the first three years of operation:

Managerial Report
Perform an analysis of the sales data for the Vintage Restaurant. Prepare a report for Karen that summarizes your findings, forecasts, and recommendations. Include the following:
- 1. A time series plot. Comment on the underlying pattern in the time series.
- 2. Using the dummy variable approach, forecast sales for January through December of the fourth year.
How would you explain this model to Karen?
Assume that January sales for the fourth year turn out to be $295,000. What was your forecast error? If this error is large, Karen may be puzzled about the difference between your forecast and the actual sales value. What can you do to resolve her uncertainty about the forecasting procedure?
Trending nowThis is a popular solution!

Chapter 5 Solutions
Essentials Of Business Analytics
- Business Discussarrow_forwardThe following data represent total ventilation measured in liters of air per minute per square meter of body area for two independent (and randomly chosen) samples. Analyze these data using the appropriate non-parametric hypothesis testarrow_forwardeach column represents before & after measurements on the same individual. Analyze with the appropriate non-parametric hypothesis test for a paired design.arrow_forward
- Should you be confident in applying your regression equation to estimate the heart rate of a python at 35°C? Why or why not?arrow_forwardGiven your fitted regression line, what would be the residual for snake #5 (10 C)?arrow_forwardCalculate the 95% confidence interval around your estimate of r using Fisher’s z-transformation. In your final answer, make sure to back-transform to the original units.arrow_forward
 College Algebra (MindTap Course List)AlgebraISBN:9781305652231Author:R. David Gustafson, Jeff HughesPublisher:Cengage Learning
