
Financial Reporting, Financial Statement Analysis and Valuation
8th Edition
ISBN: 9781285190907
Author: James M. Wahlen, Stephen P. Baginski, Mark Bradshaw
Publisher: Cengage Learning
expand_more
expand_more
format_list_bulleted
Videos
Textbook Question
Chapter 5, Problem 15PC
Refer to the profitability ratios of Coca-Cola in Problem 4.26 in Chapter 4. Exhibit 5.17 presents risk ratios for Coca-Cola for 2006–2008. As we did within the chapter for PepsiCo, we utilize Coca-Cola’s footnote disclosures to extract the amount of trade accounts payable included within the line item accounts payable and accrued expenses.
Exhibit 5.17
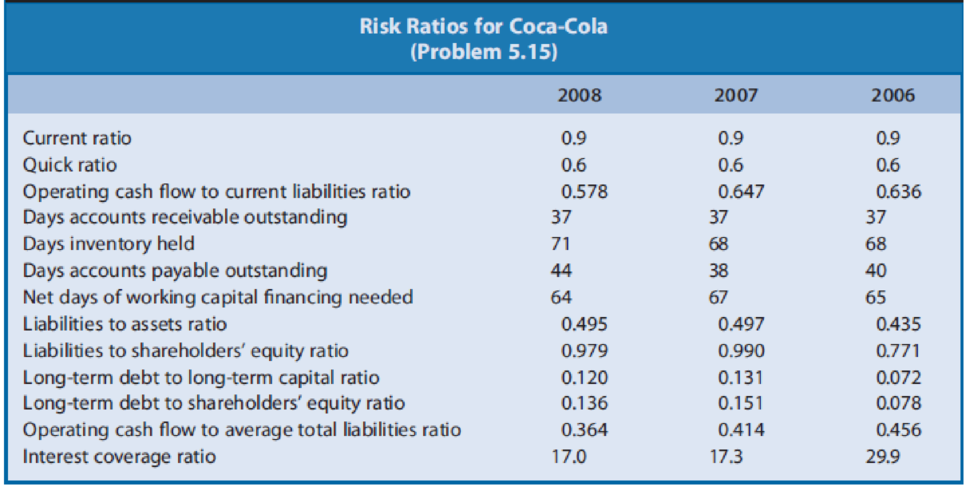
REQUIRED
- a. Assess the changes in the short-term liquidity risk of Coca-Cola between 2006 and 2008.
- b. Assess the changes in the long-term solvency risk of Coca-Cola between 2006 and 2008.
- c. Compare the short-term liquidity ratios of Coca-Cola with those of PepsiCo discussed in the chapter. Which firm appears to have more short-term liquidity risk? Explain.
- d. Compare the long-term solvency ratios of Coca-Cola with those of PepsiCo discussed in the chapter. Which firm appears to have more long-term solvency risk? Explain.
Expert Solution & Answer
Want to see the full answer?
Check out a sample textbook solution
Students have asked these similar questions
A. What is the amount of the annuity purchase required if you wish to receive a fixed payment of $200,000 for 20 years? Assume that the annuity will earn 10 percent per year.B. Calculate the annual cash flows (annuity payments) from a fixed-payment annuity if the present value of the 20-year annuity is $1 million and the annuity earns a guaranteed annual return of 10 percent. The payments are to begin at the end of the current year.C. Calculate the annual cash flows (annuity payments) from a fixed-payment annuity if the present value of the 20-year annuity is $1 million and the annuity earns a guaranteed annual return of 10 percent. The payments are to begin at the end of five years.
I need help solving question C on a financial calculator.
John wants to buy a property for $105,000 and wants an 80 percent loan for $84,000. A lenderindicates that a fully amortizing loan can be obtained for 30 years (360 months) at 6 percentinterest; however, a loan fee of $3,500 will also be necessary for John to obtain the loan.a. How much will the lender actually disburse?b. What is the APR for the borrower, assuming that the mortgage is paid off after 30 years (fullterm)?c. If John pays off the loan after five years, what is the effective interest rate? Why is it differ-ent from the effective interest rate in (b)?d. Assume the lender also imposes a prepayment penalty of 2 percent of the outstanding loanbalance if the loan is repaid within eight years of closing. If John repays the loan after fiveyears with the prepayment penalty, what is the effective interest rate?
It is now January 1. You plan to make a total of 5 deposits of $500 each, one every 6 months, with the first payment being made today. The bank pays a nominal interest rate of 14% but uses semiannual compounding. You plan to leave the money in the bank for 10 years. Round your answers to the nearest cent.
1. How much will be in your account after 10 years?
2. You must make a payment of $1,280.02 in 10 years. To get the money for this payment, you will make five equal deposits, beginning today and for the following 4 quarters, in a bank that pays a nominal interest rate of 14% with quarterly compounding. How large must each of the five payments be?
Chapter 5 Solutions
Financial Reporting, Financial Statement Analysis and Valuation
Ch. 5 - Prob. 1QECh. 5 - Prob. 2QECh. 5 - A firm has experienced an increasing current ratio...Ch. 5 - A firm has experienced a decrease in its current...Ch. 5 - Prob. 5QECh. 5 - A firm had the following values for the four debt...Ch. 5 - Prob. 7QECh. 5 - Prob. 8QECh. 5 - Prob. 9QECh. 5 - Prob. 10QE
Ch. 5 - Market equity beta measures the covariability of a...Ch. 5 - Altmans bankruptcy risk model utilizes the values...Ch. 5 - Calculating and Interpreting Risk Ratios. Refer to...Ch. 5 - Refer to the financial state-ment data for...Ch. 5 - Refer to the profitability ratios of Coca-Cola in...Ch. 5 - Delta Air Lines, Inc., is one of the largest...Ch. 5 - Prob. 17PCCh. 5 - Prob. 18PCCh. 5 - Prob. 19PCCh. 5 - Prob. 20PCCh. 5 - Prob. 21PCCh. 5 - Prob. 22PCCh. 5 - Compute the values of each of the ratios in...
Knowledge Booster


Learn more about
Need a deep-dive on the concept behind this application? Look no further. Learn more about this topic, finance and related others by exploring similar questions and additional content below.Similar questions
- Don't used hand raiting and don't used Ai solutionarrow_forwardDon't used Ai solution and don't used hand raitingarrow_forward(d) Estimate the value of a share of Cisco common stock using the discounted cash flow (DCF) model as of July 27, 2019 using the following assumptions Assumptions Discount rate (WACC) Common shares outstanding 7.60% 5,029.00 million Net nonoperating obligations (NNO) $(8,747) million NNO is negative, which means that Cisco has net nonoperating investments CSCO ($ millions) DCF Model Reported 2019 Forecast Horizon 2020 Est. 2021 Est. 2022 Est. 2023 Est. Terminal Period Increase in NOA FCFF (NOPAT - Increase in NOA) $ 1241 1303 1368 10673 11207 11767 1437 $ 12354 302 ✓ Present value of horizon FCFF 9918 9679 9445 ✔ 0 × Cum. present value of horizon FCFF $ 0 × Present value of terminal FCFF 0 ☑ Total firm value 0 ☑ NNO -8747 ✓ Firm equity value $ 0 ☑ Shares outstanding (millions) 5029 Stock price per share $ 40.05arrow_forward
- Q1: Blossom is 30 years old. She plans on retiring in 25 years, at the age of 55. She believes she will live until she is 105. In order to live comfortably, she needs a substantial retirement income. She wants to receive a weekly income of $5,000 during retirement. The payments will be made at the beginning of each week during her retirement. Also, Blossom has pledged to make an annual donation to her favorite charity during her retirement. The payments will be made at the end of each year. There will be a total of 50 annual payments to the charity. The first annual payment will be for $20,000. Blossom wants the annual payments to increase by 3% per year. The payments will end when she dies. In addition, she would like to establish a scholarship at Toronto Metropolitan University. The first payment would be $80,000 and would be made 3 years after she retires. Thereafter, the scholarship payments will be made every year. She wants the payments to continue after her death,…arrow_forwardCould you please help explain what is the research assumptions, research limitations, research delimitations and their intent? How the research assumptions, research limitations can shape the study design and scope? How the research delimitations could help focus the study and ensure its feasibility? What are the relationship between biblical principles and research concepts such as reliability and validity?arrow_forwardWhat is the concept of the working poor ? Introduction form. Explain.arrow_forward
- What is the most misunderstanding of the working poor? Explain.arrow_forwardProblem Three (15 marks) You are an analyst in charge of valuing common stocks. You have been asked to value two stocks. The first stock NEWER Inc. just paid a dividend of $6.00. The dividend is expected to increase by 60%, 45%, 30% and 15% per year, respectively, in the next four years. Thereafter, the dividend will increase by 4% per year in perpetuity. Calculate NEWER’s expected dividend for t = 1, 2, 3, 4 and 5. The required rate of return for NEWER stock is 14% compounded annually. What is NEWER’s stock price? The second stock is OLDER Inc. OLDER Inc. will pay its first dividend of $10.00 three (3) years from today. The dividend will increase by 30% per year for the following four (4) years after its first dividend payment. Thereafter, the dividend will increase by 3% per year in perpetuity. Calculate OLDER’s expected dividend for t = 1, 2, 3, 4, 5, 6, 7 and 8. The required rate of return for OLDER stock is 16% compounded annually. What is OLDER’s stock price? Now assume that…arrow_forwardProblem Three (15 marks) You are an analyst in charge of valuing common stocks. You have been asked to value two stocks. The first stock NEWER Inc. just paid a dividend of $6.00. The dividend is expected to increase by 60%, 45%, 30% and 15% per year, respectively, in the next four years. Thereafter, the dividend will increase by 4% per year in perpetuity. Calculate NEWER’s expected dividend for t = 1, 2, 3, 4 and 5. The required rate of return for NEWER stock is 14% compounded annually. What is NEWER’s stock price? The second stock is OLDER Inc. OLDER Inc. will pay its first dividend of $10.00 three (3) years from today. The dividend will increase by 30% per year for the following four (4) years after its first dividend payment. Thereafter, the dividend will increase by 3% per year in perpetuity. Calculate OLDER’s expected dividend for t = 1, 2, 3, 4, 5, 6, 7 and 8. The required rate of return for OLDER stock is 16% compounded annually. What is OLDER’s stock price? Now assume that…arrow_forward
arrow_back_ios
SEE MORE QUESTIONS
arrow_forward_ios
Recommended textbooks for you
 Financial Reporting, Financial Statement Analysis...FinanceISBN:9781285190907Author:James M. Wahlen, Stephen P. Baginski, Mark BradshawPublisher:Cengage Learning
 EBK CONTEMPORARY FINANCIAL MANAGEMENTFinanceISBN:9781337514835Author:MOYERPublisher:CENGAGE LEARNING - CONSIGNMENT
Financial Reporting, Financial Statement Analysis...
Finance
ISBN:9781285190907
Author:James M. Wahlen, Stephen P. Baginski, Mark Bradshaw
Publisher:Cengage Learning
EBK CONTEMPORARY FINANCIAL MANAGEMENT
Finance
ISBN:9781337514835
Author:MOYER
Publisher:CENGAGE LEARNING - CONSIGNMENT
How To Analyze an Income Statement; Author: Daniel Pronk;https://www.youtube.com/watch?v=uVHGgSXtQmE;License: Standard Youtube License