Concept explainers
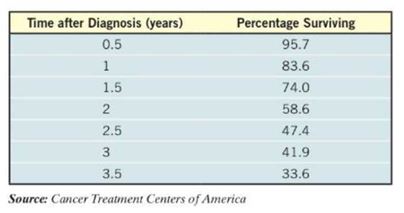
Advanced-Stage Breast Cancer The data in the table below represent the percentage of patients who have survived after diagnosis of advanced-stage breast cancer at 6-month intervals of time.

(a) Using a graphing utility, draw a
(b) Using a graphing utility, build an exponential model from the data.
(c) Express the function found in part (b) in the form .
(d) Graph the exponential function found in part (b) or (c) on the scatter diagram.
(e) What percentage of patients diagnosed with advanced-stage cancer are expected to survive for 4 years after initial diagnosis?
(f) Interpret the meaning of in the function found in part (c).
Want to see the full answer?
Check out a sample textbook solution
Chapter 4 Solutions
Precalculus: Concepts Through Functions, A Unit Circle Approach to Trigonometry (4th Edition)
- Table 2 shows a recent graduate’s credit card balance each month after graduation. a. Use exponential regression to fit a model to these data. b. If spending continues at this rate, what will the graduate’s credit card debt be one year after graduating?arrow_forwardExponential Growth Is the graph of exponential growth versus time increasing or decreasing?arrow_forwardWhat is regression analysis? Describe the process of performing regression analysis on a graphing utility.arrow_forward
- The US. import of wine (in hectoliters) for several years is given in Table 5. Determine whether the trend appearslinear. Ifso, and assuming the trend continues, in what year will imports exceed 12,000 hectoliters?arrow_forwardMaria, a biologist is observing the growth pattern of a virus. She starts with 100 of the virus that grows at a rate of 10% per hour. She will check on the virus in 24 hours. How many viruses will she find?arrow_forwardExponential Decay Is the graph of exponential decay versus time increasing or decreasing?arrow_forward
- Table 6 shows the year and the number ofpeople unemployed in a particular city for several years. Determine whether the trend appears linear. If so, and assuming the trend continues, in what year will the number of unemployed reach 5 people?arrow_forwardSales of a video game released in the year 2000 took off at first, but then steadily slowed as time moved on. Table 4 shows the number of games sold, in thousands, from the years 20002010. a. Let x represent time in years starting with x=1 for the year 2000. Let y represent the number of games sold in thousands. Use logarithmic regression to fit a model to these data. b. If games continue to sell at this rate, how many games will sell in 2015? Round to the nearest thousand.arrow_forwardThe U.S. Census tracks the percentage of persons 25 years or older who are college graduates. That data forseveral years is given in Table 4[14]. Determine whether the trend appears linear. If so, and assuming the trendcontinues. in what year will the percentage exceed 35%?arrow_forward
- Exponential Growth What is the concavity of a graph showing exponential growth?arrow_forwardWhat is the y -intercept on the graph of the logistic model given in the previous exercise?arrow_forwardHow does theta-logistic growth differ from logistic growth? Give an example ofwhen a theta-logistic growth model might better describe population growth.arrow_forward

 College AlgebraAlgebraISBN:9781305115545Author:James Stewart, Lothar Redlin, Saleem WatsonPublisher:Cengage LearningAlgebra & Trigonometry with Analytic GeometryAlgebraISBN:9781133382119Author:SwokowskiPublisher:Cengage
 Functions and Change: A Modeling Approach to Coll...AlgebraISBN:9781337111348Author:Bruce Crauder, Benny Evans, Alan NoellPublisher:Cengage Learning
 Big Ideas Math A Bridge To Success Algebra 1: Stu...AlgebraISBN:9781680331141Author:HOUGHTON MIFFLIN HARCOURTPublisher:Houghton Mifflin Harcourt


