Concept explainers
To analyze:
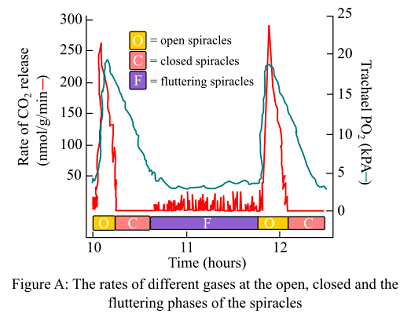
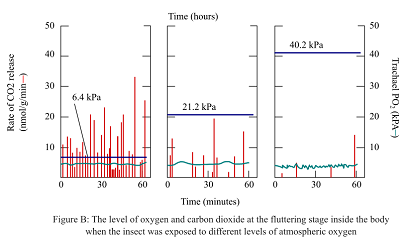
The variations in Po2 (in units of mmHg) in a typical open-close-fluttering cycle. Also explain the estimated mm Hg Po2 in the atmosphere and inside the tubes of trachea in all the three given experiments shown in figure B. Here, 1 kPa (kilopascal) = 7.5 mm Hg.
Given information:
The microscopic plastic tubes were inserted into the tracheae of the pupae of Attacus atlas moths by the researchers to study the tracheal function in the moths. The microtubes were attached to the sensors for recording the rate of CO2 that was released from the tracheae and also the intratracheal concentrations of O2.
The pupae were placed in the chambers by the researchers and the normal atmospheric levels of the gases were maintained. Researchers then recorded the behavior of spiracles, rate of CO2 release, and O2 concentrations in the tracheae. The results are shown in figure A.
In order to examine the spiracles performance in the different atmospheric conditions and their effects on the rate of CO2 release and O2 concentrations, pupae were exposed to the different levels of atmospheric O2. The levels of the release of CO2 and O2 concentrations were calculated during the fluttering stage as shown in the figure B.


Introduction:
The insectys have a unique mechanism of air exchange in their bodies. The respiratory system of the insects consists of the tracheae that is responsible for the gaseous exchange in and out of tissues. There are spiracles present that guards the trachea. They are valve-like and either remains open, closed, or in a fluttering state.
Explanation of Solution
Intratracheal partial pressure of O2 during the open phase of the spiracles in the tracheae as shown in the figure is 20.4 kPa.
If 1 kPa = 7.5mm Hg, then, Po2 during the open phase will be,7.5*20.4 = 153 mm Hg.
During the closed phase, Po2 decreases to 4–5 kPa.
If 1 kPa = 7.5mm Hg, then, PO2 during the closed phase will be,7.5*5 = 37.5 mm Hg.
During the fluttering phase, if the oxygen concentration is changed as shown in figure B, the PO2 will be calculated as
Case1, If 1 kPa = 7.5mm Hg, 7.5*6.4 = 48 mm Hg.
Case2, If 1 kPa = 7.5mm Hg, 7.5*21.2 = 159 mm Hg.
Case3, If 1 kPa = 7.5mm Hg, 7.5*40.2 = 301.5 mm Hg.
Thus, it can be concluded that the changes in approximate mm Hg of PO2 in a typical open-close fluttering cycle are 153 mm Hg and 7.5 mm Hg during the open and closed phases, respectively. Also, in the tubes of the trachea, in all the three given cases, the pressure was 48 mm Hg, 159 mm Hg, and 301.5 mm Hg, respectively.
Want to see more full solutions like this?
Chapter 48 Solutions
Life: The Science of Biology
- Describe the principle of homeostasis.arrow_forwardExplain how the hormones of the glands listed below travel around the body to target organs and tissues : Pituitary gland Hypothalamus Thyroid Parathyroid Adrenal Pineal Pancreas(islets of langerhans) Gonads (testes and ovaries) Placentaarrow_forwardWhat are the functions of the hormones produced in the glands listed below: Pituitary gland Hypothalamus Thyroid Parathyroid Adrenal Pineal Pancreas(islets of langerhans) Gonads (testes and ovaries) Placentaarrow_forward
- Describe the hormones produced in the glands listed below: Pituitary gland Hypothalamus Thyroid Parathyroid Adrenal Pineal Pancreas(islets of langerhans) Gonads (testes and ovaries) Placentaarrow_forwardPlease help me calculate drug dosage from the following information: Patient weight: 35 pounds, so 15.9 kilograms (got this by dividing 35 pounds by 2.2 kilograms) Drug dose: 0.05mg/kg Drug concentration: 2mg/mLarrow_forwardA 25-year-old woman presents to the emergency department with a 2-day history of fever, chills, severe headache, and confusion. She recently returned from a trip to sub-Saharan Africa, where she did not take malaria prophylaxis. On examination, she is febrile (39.8°C/103.6°F) and hypotensive. Laboratory studies reveal hemoglobin of 8.0 g/dL, platelet count of 50,000/μL, and evidence of hemoglobinuria. A peripheral blood smear shows ring forms and banana-shaped gametocytes. Which of the following Plasmodium species is most likely responsible for her severe symptoms? A. Plasmodium vivax B. Plasmodium ovale C. Plasmodium malariae D. Plasmodium falciparumarrow_forward
- please fill in missing parts , thank youarrow_forwardplease draw in the answers, thank youarrow_forwarda. On this first grid, assume that the DNA and RNA templates are read left to right. DNA DNA mRNA codon tRNA anticodon polypeptide _strand strand C с A T G A U G C A TRP b. Now do this AGAIN assuming that the DNA and RNA templates are read right to left. DNA DNA strand strand C mRNA codon tRNA anticodon polypeptide 0 A T G A U G с A TRParrow_forward
 Human Physiology: From Cells to Systems (MindTap ...BiologyISBN:9781285866932Author:Lauralee SherwoodPublisher:Cengage Learning
- Case Studies In Health Information ManagementBiologyISBN:9781337676908Author:SCHNERINGPublisher:Cengage
 Cardiopulmonary Anatomy & PhysiologyBiologyISBN:9781337794909Author:Des Jardins, Terry.Publisher:Cengage Learning,


