Concept explainers
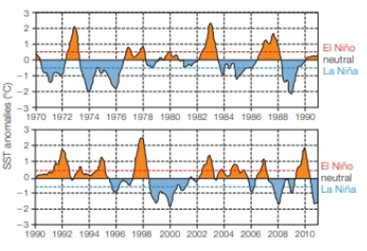
Sea Temperature To predict the effect of El Niño or La Niña events in the future, the National Oceanographic and Atmospheric Administration collects information about sea surface temperature (SST) and atmospheric conditions. They compare monthly temperature averages in the eastern equatorial Pacific Ocean to historical data and calculate the difference (the degree of anomaly) to determine if El Niño conditions, La Niña conditions, or neutral conditions are developing. El Niño is a rise in the average SST above 0.5°C. A decline of the same amount is La Niña. FIGURE 47.8 shows data for 42 years.

FIGURE 47.8 Sea surface temperature anomalies (difference from the historical mean) in the eastern equatorial Pacific Ocean. A rise above the dashed red line is an El Niño event, a decline below the blue line is La Niña
What type or conditions were in effect in the fall of 2007 when California suffered severe wildfires?
Want to see the full answer?
Check out a sample textbook solution
Chapter 47 Solutions
Biology: The Unity and Diversity of Life
- What is the approximate slope of the dashed line?arrow_forwardWhat pieces of evidence are presented that prove or reinforce the connection between climate change and the changing meteorological pattern? Answer: • Rising global temperatures (EXPLANATION) • Changes in extreme weather event (EXPLANATION) • Changes in atmospheric and oceanic circulation patterns (EXPLANATION) • Changes in precipitation patterns (EXPLANATION) • Rising sea levels (EXPLANATION) I need explanation only, thanksarrow_forwardThis is the Keeling Curve, the record of atmospheric CO2 as measured at Mauna Loa, Hawaii, over the last several decades. What do the small oscillations in this curve reflect? November 18, 2021 Carbon dioxide concentration at Mauna Loa Observatory 420 410 Full Record ending November 18, 2021 400 390 380 370 360 350 340 8 330 320 310 1960 2000 1965 1970 1975 1980 1985 1990 1995 2005 2010 2015 2020 O a. The change in the direction of ocean breezes over Hawaii b. Annual cycles, driven by the seasonal pattern of photosynthesis in the Northern Hemisphere O c. The episodic outgassing of the Mauna Loa volcano where the observatory is located d. Annual cycles, driven by CO2 incorporation into glaciers in winter Co, Concentration (ppm)arrow_forward
- The figure below shows the instrumental global surface temperature record since the late 19th centuries due to instrumental temperature record. Analyze the climate implication of the graph and 3 reasons for the trend in the graph.arrow_forwardWhen was the last time sea surface temperatures were below the 20th century average?arrow_forwardWhat weather conditions are typically associated with the Intertropical Convergence Zone (ITCZ)? Group of answer choices Clear skies and dry conditions Extreme heat and drought High winds and turbulent seas Abundant rainfall and thunderstormsarrow_forward
- Please exaplain The current trend in the warming of the planet, particularly since the year 1950, is primarily caused by 1. volcanic eruptions 2. the extent of cloud cover 3. changes in solar energy 4. changes in ocean circulation 5. the steady increase in the amount of greenhouse gases in the atmospherearrow_forwardWhich of the following statements about atmospheric carbon dioxide levels is correct? For about 800,000 years prior to human influence it varied between 180 and 300 ppm and is now above 410 ppm. For about 800,000 years prior to human influence it never exceeded 200 ppm. Its rate of increase in the past century is greater than any seen in the ice core record. Both 1 & 3arrow_forwardSuggest some possible implications of the phenomenon shown in the table (e.g. for the fishing industry or drainage basin management). Explain why these interpretations are not as reliable as the data itself.arrow_forward
- Co2 & Temperature (1964 to 2008) 400 0.7 390 0.6 380 0.5 370 0.4 360 - + 0.3 350 + 0.2 340 + 0.1 330 320 -0.1 Temperature - CO2 (ppm) 310 -0.2 300 -0.3 1964 1968 1972 1976 1980 1984 1988 1992 1996 2000 2004 2008 Summarize the trend between carbon dioxide in the atmosphere and global temperatures shown by this graph. (Hint- ignore the smaller changes from year to year and focus on the overall trend from 1964 to 2008) stv Aa MacBook Air 888 DII DD F3 F4 FS F6 F7 F8 F9 F11 # & * 3 4 5 8 9 E R Y D F G H J K CIY BIN M Global Temperature Anomaly (C) V (wdd) Zarrow_forwardWhich of the following statements explains why temperature is considered a reliable metric to investigate climate change? Select all that apply: a. changes in other aspects of climate, such as precipitation or sea level, are a response to the temperature change b. there is a long-term global database for temperature c. temperature has been measured directly for millennia d. global temperature measurements include weather variabilityarrow_forwardMajor climate models predict to occur during this century. a rise in the earth's mean surface temperature a decrease in the role of human activity in global temperature changes a decrease in global sea levels slowing temperature increases due to increased greenhouse gas emissions a sea level rise of 10 meters by 2020arrow_forward
 Biology: The Unity and Diversity of Life (MindTap...BiologyISBN:9781337408332Author:Cecie Starr, Ralph Taggart, Christine Evers, Lisa StarrPublisher:Cengage Learning
 Biology Today and Tomorrow without Physiology (Mi...BiologyISBN:9781305117396Author:Cecie Starr, Christine Evers, Lisa StarrPublisher:Cengage Learning
 Biology: The Unity and Diversity of Life (MindTap...BiologyISBN:9781305073951Author:Cecie Starr, Ralph Taggart, Christine Evers, Lisa StarrPublisher:Cengage Learning


