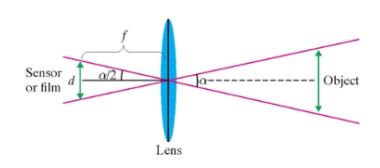
The effective focal length f of a camera is the distance required for the lens to converge light to a single focal point. The angle of view α of a camera describes the angular range (either horizontally, vertically, or diagonally) that is imaged by a camera. a. Show that α = 2 arctan d 2 f where d is the dimension of the image sensor or film. b. A typical 35 -mm camera has image dimensions of 24 mm (vertically) by 36 mm (horizontally). If the focal length is 50 mm , find the vertical and horizontal viewing angles. Round to the nearest tenth of a degree.
The effective focal length f of a camera is the distance required for the lens to converge light to a single focal point. The angle of view α of a camera describes the angular range (either horizontally, vertically, or diagonally) that is imaged by a camera. a. Show that α = 2 arctan d 2 f where d is the dimension of the image sensor or film. b. A typical 35 -mm camera has image dimensions of 24 mm (vertically) by 36 mm (horizontally). If the focal length is 50 mm , find the vertical and horizontal viewing angles. Round to the nearest tenth of a degree.
The effective focal length
f
of a camera is the distance required for the lens to converge light to a single focal point. The angle of view
α
of a camera describes the angular range (either horizontally, vertically, or diagonally) that is imaged by a camera.
a. Show that
α
=
2
arctan
d
2
f
where
d
is the dimension of the image sensor or film.
b. A typical
35
-mm
camera has image dimensions of
24
mm
(vertically) by
36
mm
(horizontally). If the focal length is
50
mm
, find the vertical and horizontal viewing angles. Round to the nearest tenth of a degree.
Can you answer this question and give step by step and why and how to get it. Can you write it (numerical method)
There are three options for investing $1150. The first earns 10% compounded annually, the second earns 10% compounded quarterly, and the third earns 10% compounded continuously. Find equations that model each investment growth and
use a graphing utility to graph each model in the same viewing window over a 20-year period. Use the graph to determine which investment yields the highest return after 20 years. What are the differences in earnings among the three
investment?
STEP 1: The formula for compound interest is
A =
nt
= P(1 + − − ) n²,
where n is the number of compoundings per year, t is the number of years, r is the interest rate, P is the principal, and A is the amount (balance) after t years. For continuous compounding, the formula reduces to
A = Pert
Find r and n for each model, and use these values to write A in terms of t for each case.
Annual Model
r=0.10
A = Y(t) = 1150 (1.10)*
n = 1
Quarterly Model
r = 0.10
n = 4
A = Q(t) = 1150(1.025) 4t
Continuous Model
r=0.10
A = C(t) =…
Use a graphing utility to find the point of intersection, if any, of the graphs of the functions. Round your result to three decimal places. (Enter NONE in any unused answer blanks.)
y = 100e0.01x
(x, y) =
y = 11,250
×
Need a deep-dive on the concept behind this application? Look no further. Learn more about this topic, calculus and related others by exploring similar questions and additional content below.


 Holt Mcdougal Larson Pre-algebra: Student Edition...AlgebraISBN:9780547587776Author:HOLT MCDOUGALPublisher:HOLT MCDOUGAL
 Algebra & Trigonometry with Analytic GeometryAlgebraISBN:9781133382119Author:SwokowskiPublisher:Cengage
 Algebra and Trigonometry (MindTap Course List)AlgebraISBN:9781305071742Author:James Stewart, Lothar Redlin, Saleem WatsonPublisher:Cengage Learning
 College Algebra (MindTap Course List)AlgebraISBN:9781305652231Author:R. David Gustafson, Jeff HughesPublisher:Cengage Learning
 Mathematics For Machine TechnologyAdvanced MathISBN:9781337798310Author:Peterson, John.Publisher:Cengage Learning,
 Elementary Geometry for College StudentsGeometryISBN:9781285195698Author:Daniel C. Alexander, Geralyn M. KoeberleinPublisher:Cengage Learning