
Applied Statistics in Business and Economics
5th Edition
ISBN: 9780077837303
Author: David Doane, Lori Seward Senior Instructor of Operations Management
Publisher: McGraw-Hill Education
expand_more
expand_more
format_list_bulleted
Videos
Textbook Question
Chapter 4.6, Problem 48SE
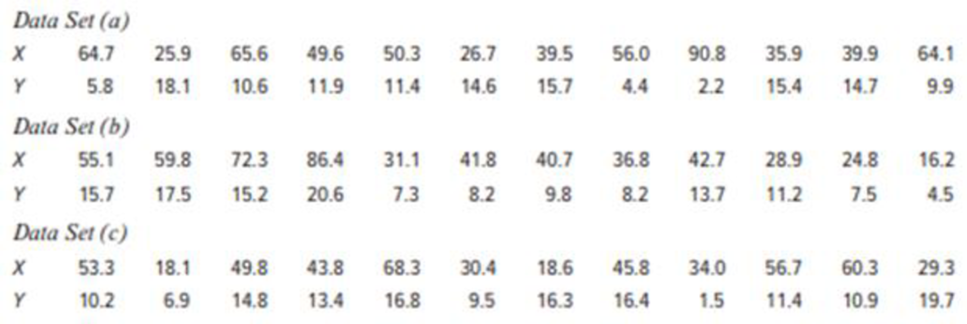
For each X-Y data set (n = 12): (a) Make a
Expert Solution & Answer
Want to see the full answer?
Check out a sample textbook solution
Students have asked these similar questions
why the answer is 3 and 10?
PS
9 Two films are shown on screen A and screen B at a cinema each evening. The numbers
of people viewing the films on 12 consecutive evenings are shown in the back-to-back
stem-and-leaf diagram.
Screen A (12) Screen B (12)
8
037
34
7 6 4 0 534
74 1645678
92 71689
Key: 116|4 represents 61 viewers for A and 64 viewers for B
A second stem-and-leaf diagram (with rows of the same width as the previous diagram)
is drawn showing the total number of people viewing films at the cinema on each of
these 12 evenings. Find the least and greatest possible number of rows that this second
diagram could have.
TIP
On the evening when 30 people viewed films on screen A, there could have been as few
as 37 or as many as 79 people viewing films on screen B.
Q.2.4 There are twelve (12) teams participating in a pub quiz. What is the probability of correctly predicting the top three teams at the end of the competition, in the correct order? Give your final answer as a fraction in its simplest form.
Chapter 4 Solutions
Applied Statistics in Business and Economics
Ch. 4.2 - Prob. 1SECh. 4.2 - For each data set, is the mode a good measure of...Ch. 4.2 - For each data set, is the mode a good measure of...Ch. 4.2 - For each data set, which best indicates a typical...Ch. 4.2 - For each data set, which best indicates a typical...Ch. 4.2 - Days on the market are shown for the 36 most...Ch. 4.2 - Scores are shown for the most recent state civil...Ch. 4.2 - Prob. 8SECh. 4.2 - CitiBank recorded the number of customers to use a...Ch. 4.2 - Prob. 10SE
Ch. 4.2 - Prob. 11SECh. 4.2 - Prob. 12SECh. 4.2 - (a) Write the Excel function for the 10 percent...Ch. 4.2 - Prob. 14SECh. 4.2 - Prob. 15SECh. 4.2 - Spirit Airlines kept track of the number of empty...Ch. 4.2 - CitiBank recorded the number of customers to use a...Ch. 4.2 - On Friday night, the owner of Chez Pierre in...Ch. 4.2 - Prob. 19SECh. 4.2 - Prob. 20SECh. 4.3 - (a) Find the mean and standard deviation for each...Ch. 4.3 - For each data set: (a) Find the mean. (b) Find the...Ch. 4.3 - In fuel economy tests in city driving conditions,...Ch. 4.3 - Over the past month, Bobs bowling score mean was...Ch. 4.3 - Prob. 25SECh. 4.3 - Prob. 26SECh. 4.3 - (a) Find the coefficient of variation for prices...Ch. 4.3 - Prob. 28SECh. 4.3 - Noodles and Company tested consumer reaction to...Ch. 4.4 - (a) By Chebyshevs Theorem, at least how many...Ch. 4.4 - An exam has a mean of 70 with a standard deviation...Ch. 4.4 - Prob. 32SECh. 4.4 - The mean collection period for accounts receivable...Ch. 4.4 - Prob. 34SECh. 4.4 - Prob. 35SECh. 4.4 - Prob. 36SECh. 4.4 - Find the original data value corresponding to each...Ch. 4.4 - CitiBank recorded the number of customers to use a...Ch. 4.4 - Prob. 39SECh. 4.5 - Scores on an accounting exam ranged from 42 to 96,...Ch. 4.5 - In 2007, total compensation (in thousands of...Ch. 4.5 - Waiting times (minutes) for a table at Joeys BBQ...Ch. 4.5 - Coffee temperatures (degrees Fahrenheit) at a...Ch. 4.5 - Prob. 44SECh. 4.5 - On San Martin Boulevard, embedded sensors kept...Ch. 4.5 - Prob. 46SECh. 4.5 - Prob. 47SECh. 4.6 - For each X-Y data set (n = 12): (a) Make a scatter...Ch. 4.6 - Your laptop gets warm (even hot) when you place it...Ch. 4.6 - Prob. 50SECh. 4.6 - Prob. 51SECh. 4.7 - Estimate the mean from this table of grouped data...Ch. 4.7 - Estimate the mean from the following table of...Ch. 4 - What are descriptive statistics? How do they...Ch. 4 - Explain each concept: (a) center, (b) variability,...Ch. 4 - Prob. 3CRCh. 4 - List strengths and weaknesses of each measure of...Ch. 4 - Prob. 5CRCh. 4 - (a) What is a bimodal distribution? (b) Explain...Ch. 4 - Prob. 7CRCh. 4 - Prob. 8CRCh. 4 - (a) Which standard deviation formula (population,...Ch. 4 - (a) To what kind of data does Chebyshevs Theorem...Ch. 4 - Prob. 11CRCh. 4 - Prob. 12CRCh. 4 - Prob. 13CRCh. 4 - Prob. 14CRCh. 4 - (a) Explain the method of medians for calculating...Ch. 4 - (a) What is a box plot? What does it tell us? (b)...Ch. 4 - Prob. 17CRCh. 4 - Prob. 18CRCh. 4 - Prob. 19CRCh. 4 - (a) What is kurtosis? (b) Sketch a platykurtic...Ch. 4 - Prob. 54CECh. 4 - If the mean asset turnover for retail firms is...Ch. 4 - Prob. 56CECh. 4 - During a rock concert, the noise level (in...Ch. 4 - Bags of jelly beans have a mean weight of 396 gm...Ch. 4 - Based on experience, the Ball Corporations...Ch. 4 - SAT scores for the entering class of 2010 at...Ch. 4 - Prob. 61CECh. 4 - The average time a Boulder High varsity lacrosse...Ch. 4 - Prob. 63CECh. 4 - Below are monthly rents paid by 30 students who...Ch. 4 - How many days in advance do travelers purchase...Ch. 4 - The durations (minutes) of 26 electric power...Ch. 4 - The U.S. Postal Service will ship a Priority Mail...Ch. 4 - Prob. 68CECh. 4 - Prob. 69CECh. 4 - Prob. 70CECh. 4 - Prob. 71CECh. 4 - A plumbing suppliers mean monthly demand for vinyl...Ch. 4 - Prob. 73CECh. 4 - Prob. 74CECh. 4 - Prob. 75CECh. 4 - Caffeine content in a 5-ounce cup of brewed coffee...Ch. 4 - Prob. 77CECh. 4 - Prob. 78CECh. 4 - Prob. 79CECh. 4 - Prob. 80CECh. 4 - Prob. 81CECh. 4 - The median waiting time for a liver transplant in...Ch. 4 - A small suburban community agreed to purchase...Ch. 4 - A companys contractual trigger point for a union...Ch. 4 - Prob. 85CECh. 4 - (a) Enter the Excel function...Ch. 4 - Note: In each of the following tables, the upper...Ch. 4 - Prob. 88CECh. 4 - The self-reported number of hours worked per week...Ch. 4 - How long does it take to fly from Denver to...Ch. 4 - (a) Make an Excel scatter plot of X = 1990 assault...Ch. 4 - (a) Make an Excel scatter plot of X = airspeed...Ch. 4 - Prob. 95CECh. 4 - Prob. 1ERQCh. 4 - Which is not an ethical obligation of a...Ch. 4 - Prob. 3ERQCh. 4 - Prob. 4ERQCh. 4 - Give the type of measurement (nominal, ordinal,...Ch. 4 - Prob. 6ERQCh. 4 - To choose a sample of 12 students from a...Ch. 4 - Which of the following is not a reason for...Ch. 4 - Which statement is correct? Why not the others? a....Ch. 4 - Prob. 10ERQCh. 4 - The management of a theme park obtained a random...Ch. 4 - Which one of the following is true? Why not the...Ch. 4 - Prob. 13ERQCh. 4 - Prob. 14ERQCh. 4 - Here are the ages of a random sample of 20 CEOs...Ch. 4 - Prob. 16ERQCh. 4 - Prob. 17ERQCh. 4 - Prob. 18ERQCh. 4 - Which is not a characteristic of using a log scale...
Knowledge Booster


Learn more about
Need a deep-dive on the concept behind this application? Look no further. Learn more about this topic, statistics and related others by exploring similar questions and additional content below.Similar questions
- The table below indicates the number of years of experience of a sample of employees who work on a particular production line and the corresponding number of units of a good that each employee produced last month. Years of Experience (x) Number of Goods (y) 11 63 5 57 1 48 4 54 5 45 3 51 Q.1.1 By completing the table below and then applying the relevant formulae, determine the line of best fit for this bivariate data set. Do NOT change the units for the variables. X y X2 xy Ex= Ey= EX2 EXY= Q.1.2 Estimate the number of units of the good that would have been produced last month by an employee with 8 years of experience. Q.1.3 Using your calculator, determine the coefficient of correlation for the data set. Interpret your answer. Q.1.4 Compute the coefficient of determination for the data set. Interpret your answer.arrow_forwardCan you answer this question for mearrow_forwardTechniques QUAT6221 2025 PT B... TM Tabudi Maphoru Activities Assessments Class Progress lIE Library • Help v The table below shows the prices (R) and quantities (kg) of rice, meat and potatoes items bought during 2013 and 2014: 2013 2014 P1Qo PoQo Q1Po P1Q1 Price Ро Quantity Qo Price P1 Quantity Q1 Rice 7 80 6 70 480 560 490 420 Meat 30 50 35 60 1 750 1 500 1 800 2 100 Potatoes 3 100 3 100 300 300 300 300 TOTAL 40 230 44 230 2 530 2 360 2 590 2 820 Instructions: 1 Corall dawn to tha bottom of thir ceraan urina se se tha haca nariad in archerca antarand cubmit Q Search ENG US 口X 2025/05arrow_forward
- The table below indicates the number of years of experience of a sample of employees who work on a particular production line and the corresponding number of units of a good that each employee produced last month. Years of Experience (x) Number of Goods (y) 11 63 5 57 1 48 4 54 45 3 51 Q.1.1 By completing the table below and then applying the relevant formulae, determine the line of best fit for this bivariate data set. Do NOT change the units for the variables. X y X2 xy Ex= Ey= EX2 EXY= Q.1.2 Estimate the number of units of the good that would have been produced last month by an employee with 8 years of experience. Q.1.3 Using your calculator, determine the coefficient of correlation for the data set. Interpret your answer. Q.1.4 Compute the coefficient of determination for the data set. Interpret your answer.arrow_forwardQ.3.2 A sample of consumers was asked to name their favourite fruit. The results regarding the popularity of the different fruits are given in the following table. Type of Fruit Number of Consumers Banana 25 Apple 20 Orange 5 TOTAL 50 Draw a bar chart to graphically illustrate the results given in the table.arrow_forwardQ.2.3 The probability that a randomly selected employee of Company Z is female is 0.75. The probability that an employee of the same company works in the Production department, given that the employee is female, is 0.25. What is the probability that a randomly selected employee of the company will be female and will work in the Production department? Q.2.4 There are twelve (12) teams participating in a pub quiz. What is the probability of correctly predicting the top three teams at the end of the competition, in the correct order? Give your final answer as a fraction in its simplest form.arrow_forward
- Q.2.1 A bag contains 13 red and 9 green marbles. You are asked to select two (2) marbles from the bag. The first marble selected will not be placed back into the bag. Q.2.1.1 Construct a probability tree to indicate the various possible outcomes and their probabilities (as fractions). Q.2.1.2 What is the probability that the two selected marbles will be the same colour? Q.2.2 The following contingency table gives the results of a sample survey of South African male and female respondents with regard to their preferred brand of sports watch: PREFERRED BRAND OF SPORTS WATCH Samsung Apple Garmin TOTAL No. of Females 30 100 40 170 No. of Males 75 125 80 280 TOTAL 105 225 120 450 Q.2.2.1 What is the probability of randomly selecting a respondent from the sample who prefers Garmin? Q.2.2.2 What is the probability of randomly selecting a respondent from the sample who is not female? Q.2.2.3 What is the probability of randomly…arrow_forwardTest the claim that a student's pulse rate is different when taking a quiz than attending a regular class. The mean pulse rate difference is 2.7 with 10 students. Use a significance level of 0.005. Pulse rate difference(Quiz - Lecture) 2 -1 5 -8 1 20 15 -4 9 -12arrow_forwardThe following ordered data list shows the data speeds for cell phones used by a telephone company at an airport: A. Calculate the Measures of Central Tendency from the ungrouped data list. B. Group the data in an appropriate frequency table. C. Calculate the Measures of Central Tendency using the table in point B. D. Are there differences in the measurements obtained in A and C? Why (give at least one justified reason)? I leave the answers to A and B to resolve the remaining two. 0.8 1.4 1.8 1.9 3.2 3.6 4.5 4.5 4.6 6.2 6.5 7.7 7.9 9.9 10.2 10.3 10.9 11.1 11.1 11.6 11.8 12.0 13.1 13.5 13.7 14.1 14.2 14.7 15.0 15.1 15.5 15.8 16.0 17.5 18.2 20.2 21.1 21.5 22.2 22.4 23.1 24.5 25.7 28.5 34.6 38.5 43.0 55.6 71.3 77.8 A. Measures of Central Tendency We are to calculate: Mean, Median, Mode The data (already ordered) is: 0.8, 1.4, 1.8, 1.9, 3.2, 3.6, 4.5, 4.5, 4.6, 6.2, 6.5, 7.7, 7.9, 9.9, 10.2, 10.3, 10.9, 11.1, 11.1, 11.6, 11.8, 12.0, 13.1, 13.5, 13.7, 14.1, 14.2, 14.7, 15.0, 15.1, 15.5,…arrow_forward
- PEER REPLY 1: Choose a classmate's Main Post. 1. Indicate a range of values for the independent variable (x) that is reasonable based on the data provided. 2. Explain what the predicted range of dependent values should be based on the range of independent values.arrow_forwardIn a company with 80 employees, 60 earn $10.00 per hour and 20 earn $13.00 per hour. Is this average hourly wage considered representative?arrow_forwardThe following is a list of questions answered correctly on an exam. Calculate the Measures of Central Tendency from the ungrouped data list. NUMBER OF QUESTIONS ANSWERED CORRECTLY ON AN APTITUDE EXAM 112 72 69 97 107 73 92 76 86 73 126 128 118 127 124 82 104 132 134 83 92 108 96 100 92 115 76 91 102 81 95 141 81 80 106 84 119 113 98 75 68 98 115 106 95 100 85 94 106 119arrow_forward
arrow_back_ios
SEE MORE QUESTIONS
arrow_forward_ios
Recommended textbooks for you
 Glencoe Algebra 1, Student Edition, 9780079039897...AlgebraISBN:9780079039897Author:CarterPublisher:McGraw Hill
 Holt Mcdougal Larson Pre-algebra: Student Edition...AlgebraISBN:9780547587776Author:HOLT MCDOUGALPublisher:HOLT MCDOUGAL
 Big Ideas Math A Bridge To Success Algebra 1: Stu...AlgebraISBN:9781680331141Author:HOUGHTON MIFFLIN HARCOURTPublisher:Houghton Mifflin Harcourt
 Functions and Change: A Modeling Approach to Coll...AlgebraISBN:9781337111348Author:Bruce Crauder, Benny Evans, Alan NoellPublisher:Cengage Learning
 Trigonometry (MindTap Course List)TrigonometryISBN:9781337278461Author:Ron LarsonPublisher:Cengage Learning
Glencoe Algebra 1, Student Edition, 9780079039897...
Algebra
ISBN:9780079039897
Author:Carter
Publisher:McGraw Hill
Holt Mcdougal Larson Pre-algebra: Student Edition...
Algebra
ISBN:9780547587776
Author:HOLT MCDOUGAL
Publisher:HOLT MCDOUGAL
Big Ideas Math A Bridge To Success Algebra 1: Stu...
Algebra
ISBN:9781680331141
Author:HOUGHTON MIFFLIN HARCOURT
Publisher:Houghton Mifflin Harcourt
Functions and Change: A Modeling Approach to Coll...
Algebra
ISBN:9781337111348
Author:Bruce Crauder, Benny Evans, Alan Noell
Publisher:Cengage Learning
Trigonometry (MindTap Course List)
Trigonometry
ISBN:9781337278461
Author:Ron Larson
Publisher:Cengage Learning
What is a Relation? | Don't Memorise; Author: Don't Memorise;https://www.youtube.com/watch?v=hV1_wvsdJCE;License: Standard YouTube License, CC-BY
RELATIONS-DOMAIN, RANGE AND CO-DOMAIN (RELATIONS AND FUNCTIONS CBSE/ ISC MATHS); Author: Neha Agrawal Mathematically Inclined;https://www.youtube.com/watch?v=u4IQh46VoU4;License: Standard YouTube License, CC-BY