
Concept explainers
Videos
a.
Find a trigonometric model for the temperatures in International Falls.
a.
Answer to Problem 84E
Explanation of Solution
Given information:
The table shows the maximum daily high temperatures (in degrees Fahrenheit) in Las Vegas
Model for the temperatures in Las Vegas is
Calculation:
We are given with the data, which shows the maximum daily high temperatures in Las Vegas L, and international falls l, in degrees Fahrenheit, for month t,
We are given with a model for the temperature in Las Vegas,
Now to model the data for international Falls,
Amplitude :
Period:
Because the maximum temperature occurs in the seventh month,
Therefore,
So,
The average temperature is
So,
Hence, the model is
b.
How well does the model fit the data?
b.
Answer to Problem 84E
Explanation of Solution
Given information:
The table shows the maximum daily high temperatures (in degrees Fahrenheit) in Las Vegas
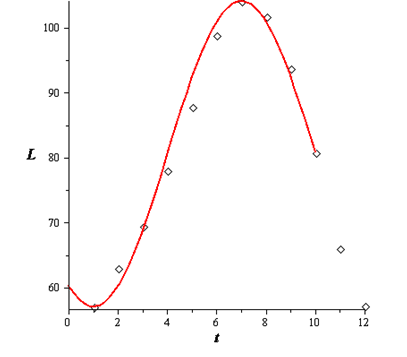
Use a graphing utility to graph the data points and the model for the temperatures in Las Vegas. How well does the model fit the data?
Calculation:
We are given with the data, which shows the maximum daily high temperatures in Las Vegas L, and international falls l, in degrees Fahrenheit, for month t,
We are given with a model for the temperature in Las Vegas,
Let us first plot the points and graph the model Los Vegas,

Hence, the graph is plotted.
c.
How well does the model fit the data?
c.
Answer to Problem 84E

Explanation of Solution
Given information:
The table shows the maximum daily high temperatures (in degrees Fahrenheit) in Las Vegas
Use the graphing utility to graph the data points and the model for the temperatures in International Falls. How well does the model fit the data?
Calculation:We are given with the data, which shows the maximum daily high temperatures in Las Vegas L, and international falls l, in degrees Fahrenheit, for month t,
We are given with a model for the temperature in Las Vegas,
The model fit the data well.
Let us now plot the points and graphs the model of international falls,
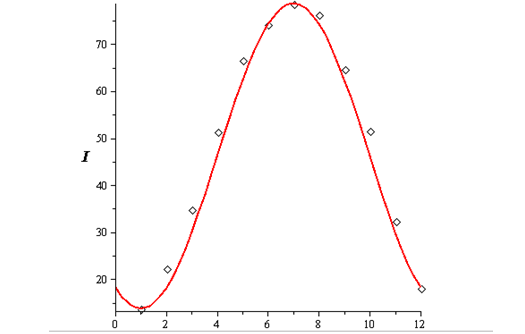
Hence, the graph is plotted.
d.
Use the models to estimate the average maximum temperature in each city.
d.
Answer to Problem 84E
Las Vegas:
Explanation of Solution
Given information:
The table shows the maximum daily high temperatures (in degrees Fahrenheit) in Las Vegas
Use the models to estimate the average maximum temperature in each city. Which value in each model did you use? Explain
Calculation:
We are given with the data, which shows the maximum daily high temperatures in Las Vegas L, and international falls l, in degrees Fahrenheit, for month t,
We are given with a model for the temperature in Las Vegas,
Hence, The annual average temperature is
Las Vegas:
International Falls:
We used the constant term.
e.
What is the period of each model?
e.
Answer to Problem 84E
Explanation of Solution
Given information:
The table shows the maximum daily high temperatures (in degrees Fahrenheit) in Las Vegas
What is the period of each model? Are the periods what you expected? Explain.
Calculation:
We are given with the data, which shows the maximum daily high temperatures in Las Vegas
We are given with a model for the temperature in Las Vegas,
Hence, The period for both the model is
Yes, this is what we expected, as the number of months in a year is
f.
Which city has the greater variability in temperature throughout the year? Which value in each model determines this variability? Explain
f.
Answer to Problem 84E
Explanation of Solution
Given information:
The table shows the maximum daily high temperatures (in degrees Fahrenheit) in Las Vegas
Which city has the greater variability in temperature throughout the year? Which value in each model determines this variability? Explain
Calculation:
We are given with the data, which shows the maximum daily high temperatures in Las Vegas
We are given with a model for the temperature in Las Vegas,
Hence , International Falls has the greater variability,
Amplitude determines this factor.
The greater the amplitude, greater is the variability.
Chapter 4 Solutions
EBK PRECALCULUS W/LIMITS


- On from the equation: 2 u = C₁ + C₂ Y + Czy + Cu y³ Find C₁, C₂, C3 and Cy Using these following Cases : (a) 4=0 at y=0 (b) U = U∞ at y = 8 du (c) at Y = S ду --y. ди = 0 at y = 0 бугarrow_forwardTips S ps L 50. lim x2 - 4 x-2x+2 51. lim 22 - X 52. 53. x 0 Answer lim x 0 lim 2-5 X 2x2 2 x² Answer -> 54. lim T - 3x - - 25 +5 b+1 b3b+3 55. lim X x-1 x 1 Answer 56. lim x+2 x 2 x 2 57. lim x²-x-6 x-2 x²+x-2 Answer-> 23-8 58. lim 2-22-2arrow_forwardS 36. lim 5x+2 x-2 37. lim √√2x4 + x² x-3 Answer-> 2x3 +4 38. lim x12 √ x² + 1 √√x² + 8 39. lim x-1 2x+4 Answer 40. lim x3 2x x√x² + 7 √√2x+3arrow_forward
- i don't understand how to get these answers please help!arrow_forwardEnter your answer in interval notation. No decimal entries allowed. Type oo (lower case o) for ∞ and -oo for -∞ if needed. Domain: Question Help: Message instructorarrow_forwardWrite a formula for the function g that results when the graph of the function f(x) = = 4 X is reflected about the y-axis, horizontally compressed by a factor of 2, shifted 7 units left, reflected about the x-axis and shifted 3 units up. g(x): = Question Help: Message instructorarrow_forward
- Question 7 4 pts 1 Details The value of China's exports of automobiles and parts (in billions of dollars) is approximately f(x) = 1.8208e0.3387x, where x = 0 corresponds to 1998. In what year did/will the exports reach $10.4 billion?arrow_forwardQuestion 7 4 pts 1 Detai The value of China's exports of automobiles and parts (in billions of dollars) is approximately f(x) = 1.8208e 0.3387x, where x = 0 corresponds to 1998. In what year did/will the exports reach $10.4 billion?arrow_forwardWrite a formula for the function g that results when the graph of the function f(x) = = 4 X is reflected about the y-axis, horizontally compressed by a factor of 2, shifted 7 units left, reflected about the x-axis and shifted 3 units up. g(x) = Question Help: Message instructorarrow_forward
 Calculus: Early TranscendentalsCalculusISBN:9781285741550Author:James StewartPublisher:Cengage Learning
 Thomas' Calculus (14th Edition)CalculusISBN:9780134438986Author:Joel R. Hass, Christopher E. Heil, Maurice D. WeirPublisher:PEARSON
 Calculus: Early Transcendentals (3rd Edition)CalculusISBN:9780134763644Author:William L. Briggs, Lyle Cochran, Bernard Gillett, Eric SchulzPublisher:PEARSON
 Calculus: Early TranscendentalsCalculusISBN:9781319050740Author:Jon Rogawski, Colin Adams, Robert FranzosaPublisher:W. H. Freeman
 Calculus: Early Transcendental FunctionsCalculusISBN:9781337552516Author:Ron Larson, Bruce H. EdwardsPublisher:Cengage Learning