
Concept explainers
Videos
A cylindrical hole is drilled in a block, and a cylindrical piston is placed in the hole. The clearance is equal to one-half the difference between the diameters of the hole and the piston. The diameter of the hole is
- a. Find the mean clearance.
- b. Find the standard deviation of the clearance.
- c. What is the
probability that the clearance is less than 0.05 cm? - d. Find the 25th percentile of the clearance.
- e. Specifications call for the clearance to be between 0.05 and 0.09 cm. What is the probability that the clearance meets the specification?
- f. It is possible to adjust the mean hole diameter. To what value should it be adjusted so as to maximize the probability that the clearance will be between 0.05 and 0.09 cm?
a.
Determine the mean clearance.
Answer to Problem 13E
The mean clearance is 0.06 cm.
Explanation of Solution
Given info:
The diameter of the hole is normally distributed with mean
Calculation:
The random variable X is defined as the diameter of a hole and the random variable Y as the diameter of a piston. Then X follows Normal with parameters
The clearance is denoted as C and is defined as
The mean clearance is,
Thus, the mean clearance is 0.06 cm.
b.
Determine the standard deviation of the clearance.
Answer to Problem 13E
The standard deviation of the clearance is 0.01458 cm.
Explanation of Solution
Calculation:
The standard deviation of the clearance is,
Thus, the standard deviation of the clearance is 0.01458 cm.
c.
Find the probability that the clearance is less than 0.05.
Answer to Problem 13E
The probability of clearance less than 0.05 is
Explanation of Solution
Calculation:
The random variable C is a linear combination of two normal random variables. Then C follows normal with mean
The required probability is,
The formula to convert X values into z score is,
Substitute 0.06 for
The above probability can be obtained by finding the areas to the left of –0.69.
The shaded region represents the area to the left of –0.69 is shown below:
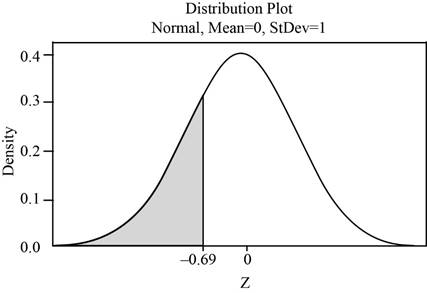
Use Table A.2: Cumulative Normal Distribution to find the area.
Procedure:
For probability value for
- Locate –0.6 in the left column of the Table A.2.
- Obtain the value in the corresponding to the row below 0.09.
- The required value is 0.2451.
That is,
Then,
Thus, the value of
d.
Find the value of 25th percentile of the clearance.
Answer to Problem 13E
The value of 25th percentile of the clearance is 0.0502 cm.
Explanation of Solution
Calculation:
The 25th percentile is denoted as
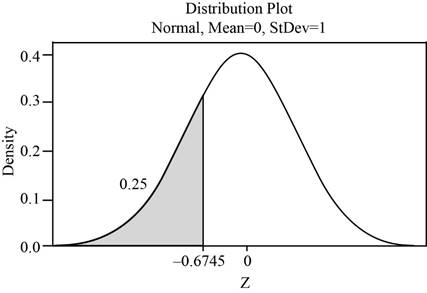
The 25th percentile of a random variable C is defined as
The value of the random variable C for the bottom 0.25 is same as the value of C for the top 0.75. The area to the left of Z is 0.25 and right of Z is 0.75.
The shaded region represents of the area 25th percentile of a normal random variable is shown below:
Use Table A.2: Cumulative Normal Distribution to find the critical value.
Procedure:
- Locate an approximate area of 0.2500 in the body of the A.2 table. The area closest to 0.2500 is 0.2514.
- Move left until the first column and note the value as –0.6.
- Move upward until the top row reached and note the value as 0.07.
Thus, the corresponding z-score is –0.67.
Therefore, the 25th percentile for the random variable C is,
Thus, the 25th percentile of the clearance is 0.0502 cm.
e.
Find the probability that the clearance to be between 0.05 cm and 0.09 cm.
Answer to Problem 13E
The probability that the clearance to be between 0.05 cm and 0.09 cm is 0.7352.
Explanation of Solution
Calculation:
The probability that the clearance to be between 0.05 cm and 0.09 cm implies that
Substitute 0.06 for
The value of
The shaded region represents the area between
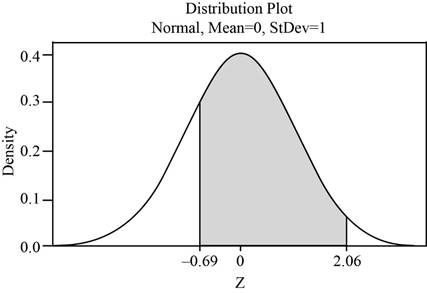
The area under the standard normal curve that lies between
Use Table A.2: Cumulative Normal Distribution to find the areas.
Procedure:
For z at 2.06,
- Locate 2.0 in the left column of the Table A.2.
- Obtain the value in the corresponding row below 0.06.
That is,
For z at –0.69,
- Locate –0.6 in the left column of the Table A.2.
- Obtain the value in the corresponding row below 0.06.
That is,
Thus,
Thus, the area under the normal curves between
f.
Find the value of adjusted mean hole diameter so as to maximize the probability that the clearance to be between 0.05 cm and 0.09 cm.
Answer to Problem 13E
The value of adjusted mean hole diameter has to be adjusted to 15.2cm to maximize the probability that the clearance to be between 0.05 cm and 0.09.
Explanation of Solution
Calculation:
The probability is maximized at the midpoint between 0.05 cm and 0.09 cm.
The midpoint is
That is, the probability is maximized at
The mean diameter of the piston is,
Then, the adjusted mean hole diameter must satisfies the following equation,
Substitute
On solving,
Thus, the adjusted mean hole diameter is 15.02 cm.
The probability that the clearance to be between 0.05 cm and 0.09 cm implies that
Substitute 0.07 for
The value of
The shaded region represents the area between
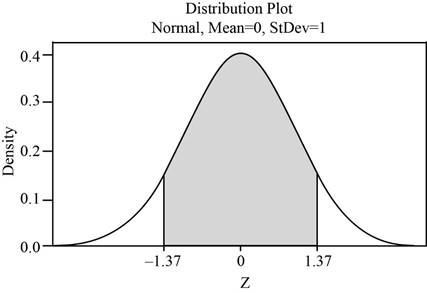
The area under the standard normal curve that lies between
Use Table A.2: Cumulative Normal Distribution to find the areas.
Procedure:
For z at 1.37,
- Locate 1.3 in the left column of the Table A.2.
- Obtain the value in the corresponding row below 0.07.
That is,
For z at –1.37,
- Locate –1.3 in the left column of the Table A.2.
- Obtain the value in the corresponding row below 0.07.
That is,
Thus,
Thus, the area under the normal curves between
Thus, the probability of the clearance to be between 0.05 cm and 0.09 cm is maximized when the mean clearance becomes 0.07.
Therefore, the value of adjusted mean hole diameter has to be adjusted to 15.2cm to maximize the probability that the clearance to be between 0.05 cm and 0.09.
Want to see more full solutions like this?
Chapter 4 Solutions
Statistics for Engineers and Scientists (Looseleaf)


- Consider an MA(6) model with θ1 = 0.5, θ2 = −25, θ3 = 0.125, θ4 = −0.0625, θ5 = 0.03125, and θ6 = −0.015625. Find a much simpler model that has nearly the same ψ-weights.arrow_forwardLet {Yt} be an AR(2) process of the special form Yt = φ2Yt − 2 + et. Use first principles to find the range of values of φ2 for which the process is stationary.arrow_forwardDescribe the important characteristics of the autocorrelation function for the following models: (a) MA(1), (b) MA(2), (c) AR(1), (d) AR(2), and (e) ARMA(1,1).arrow_forward
- « CENGAGE MINDTAP Quiz: Chapter 38 Assignment: Quiz: Chapter 38 ips Questions ra1kw08h_ch38.15m 13. 14. 15. O Which sentence has modifiers in the correct place? O a. When called, she for a medical emergency responds quickly. b. Without giving away too much of the plot, Helena described the heroine's actions in the film. O c. Nearly the snakebite victim died before the proper antitoxin was injected. . O O 16 16. O 17. 18. O 19. O 20 20. 21 21. 22. 22 DS 23. 23 24. 25. O O Oarrow_forwardQuestions ra1kw08h_ch36.14m 12. 13. 14. 15. 16. Ӧ 17. 18. 19. OS 20. Two separate sentences need Oa. two separate subjects. Ob. two dependent clauses. c. one shared subject.arrow_forwardCustomers experiencing technical difficulty with their Internet cable service may call an 800 number for technical support. It takes the technician between 30 seconds and 11 minutes to resolve the problem. The distribution of this support time follows the uniform distribution. Required: a. What are the values for a and b in minutes? Note: Do not round your intermediate calculations. Round your answers to 1 decimal place. b-1. What is the mean time to resolve the problem? b-2. What is the standard deviation of the time? c. What percent of the problems take more than 5 minutes to resolve? d. Suppose we wish to find the middle 50% of the problem-solving times. What are the end points of these two times?arrow_forward
- Exercise 6-6 (Algo) (LO6-3) The director of admissions at Kinzua University in Nova Scotia estimated the distribution of student admissions for the fall semester on the basis of past experience. Admissions Probability 1,100 0.5 1,400 0.4 1,300 0.1 Click here for the Excel Data File Required: What is the expected number of admissions for the fall semester? Compute the variance and the standard deviation of the number of admissions. Note: Round your standard deviation to 2 decimal places.arrow_forward1. Find the mean of the x-values (x-bar) and the mean of the y-values (y-bar) and write/label each here: 2. Label the second row in the table using proper notation; then, complete the table. In the fifth and sixth columns, show the 'products' of what you're multiplying, as well as the answers. X y x minus x-bar y minus y-bar (x minus x-bar)(y minus y-bar) (x minus x-bar)^2 xy 16 20 34 4-2 5 2 3. Write the sums that represents Sxx and Sxy in the table, at the bottom of their respective columns. 4. Find the slope of the Regression line: bi = (simplify your answer) 5. Find the y-intercept of the Regression line, and then write the equation of the Regression line. Show your work. Then, BOX your final answer. Express your line as "y-hat equals...arrow_forwardApply STATA commands & submit the output for each question only when indicated below i. Generate the log of birthweight and family income of children. Name these new variables Ibwght & Ifaminc. Include the output of this code. ii. Apply the command sum with the detail option to the variable faminc. Note: you should find the 25th percentile value, the 50th percentile and the 75th percentile value of faminc from the output - you will need it to answer the next question Include the output of this code. iii. iv. Use the output from part ii of this question to Generate a variable called "high_faminc" that takes a value 1 if faminc is less than or equal to the 25th percentile, it takes the value 2 if faminc is greater than 25th percentile but less than or equal to the 50th percentile, it takes the value 3 if faminc is greater than 50th percentile but less than or equal to the 75th percentile, it takes the value 4 if faminc is greater than the 75th percentile. Include the outcome of this code…arrow_forward
- solve this on paperarrow_forwardApply STATA commands & submit the output for each question only when indicated below i. Apply the command egen to create a variable called "wyd" which is the rowtotal function on variables bwght & faminc. ii. Apply the list command for the first 10 observations to show that the code in part i worked. Include the outcome of this code iii. Apply the egen command to create a new variable called "bwghtsum" using the sum function on variable bwght by the variable high_faminc (Note: need to apply the bysort' statement) iv. Apply the "by high_faminc" statement to find the V. descriptive statistics of bwght and bwghtsum Include the output of this code. Why is there a difference between the standard deviations of bwght and bwghtsum from part iv of this question?arrow_forwardAccording to a health information website, the distribution of adults’ diastolic blood pressure (in millimeters of mercury, mmHg) can be modeled by a normal distribution with mean 70 mmHg and standard deviation 20 mmHg. b. Above what diastolic pressure would classify someone in the highest 1% of blood pressures? Show all calculations used.arrow_forward
 Big Ideas Math A Bridge To Success Algebra 1: Stu...AlgebraISBN:9781680331141Author:HOUGHTON MIFFLIN HARCOURTPublisher:Houghton Mifflin Harcourt
 Glencoe Algebra 1, Student Edition, 9780079039897...AlgebraISBN:9780079039897Author:CarterPublisher:McGraw Hill
 College Algebra (MindTap Course List)AlgebraISBN:9781305652231Author:R. David Gustafson, Jeff HughesPublisher:Cengage Learning