Concept explainers
Learning Curve A learning curve is a graph of a function
where k and C are positive constants and
(a) Express the learning time t as a function of the performance level P.
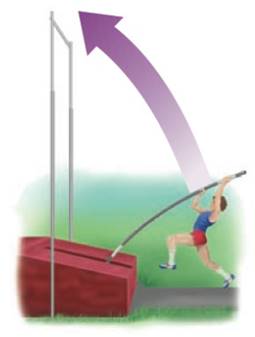
(b) For s pole-vaulter in training, the learning curve is given by
where
(c) Draw a graph of the learning curve in part (b).
Want to see the full answer?
Check out a sample textbook solutionChapter 4 Solutions
Algebra and Trigonometry (MindTap Course List)
- bThe average rate of change of the linear function f(x)=3x+5 between any two points is ________.arrow_forwardFocal Length A refracting telescope has a main lens, or objective lens, and a second lens, the eyepiece see Figure 3.42. For a given magnification M of the telescope, the focal length F of the objective lens is a linear function of the focal length Fe of the eyepiece. For example, a telescope with magnification M=80 times can be constructed using various combinations of lenses. The following table gives some samples of focal length for telescopes with magnification M=80. Here focal lengths are in centimeters. Fe 0.3 0.5 0.7 0.9 F 24 40 56 72 a. Construct a linear model for the data. b. In this example, the magnification M is 80. In general, F is proportional to Fe, and the constant of proportionality is M. Use this relation to write a formula for F in terms of Fe and M. c. Solve the equation you obtained in part b for M and thus obtain a formula for magnification as a function of objective lens focal length and eyepiece focal length. d. To achieve a large magnification, how should the objective and eyepiece lenses be selected? FIGURE 3.42arrow_forwardTuition at American Public Universities This is a continuation of Exercise 6. The following table shows the average yearly in-state tuition and required fees, in dollars, charged by four-year American public universities in the school year ending in the given year. Date Average tuition 2012 8318 2013 8595 2014 8872 2015 9149 2016 9426 a. Show that these data can be modeled by a linear function, and find its formula. b. What is the slope for the linear function modeling tuition and required fees for public universities? c. What is the slope of the linear function modeling tuition and required fees for private universities? Note: See Exercise 6. d. Explain what the information in parts b and c tells you about the rate of increase in tuition in public versus private institutions. e. Which type of institution shows the larger percentage increase from 2015 to 2016? 6. Tuition at American Private Universities The following table shows the average yearly tuition and required fees, in dollars, charged by four-year American private nonprofit universities in the school year ending in the given year. Date Average tuition 2012 27, 870 2013 29, 004 2014 30, 138 2015 31, 272 2016 32, 406 a. Show that these data can be modeled by a linear function, and find its formula. b. Plot the data points and add the graph of the linear formula you found in part a. c. What prediction does this formula give for average tuition and fees at four-year American private nonprofit universities for the academic year ending in 2021?arrow_forward
- Grazing Kangaroos The amount of vegetation eaten in a day by a grazing animal V of food available measured as biomass, in units such as pounds per acre. This relationship is called the functional response. If there is little vegetation available, the daily intake will be small, since the animal will have difficulty finding and eating the food. As the amount of food biomass increases, so does the daily intake. Clearly, though, there is a limit to the amount the animal will eat, regardless of the amount of food available. This maximum amount eaten is the satiation level. a.For the western grey kangaroo of Australia, the functional response is G=2.54.8e0.004V, where G=G(V) is the daily intake measured in pounds and V is the vegetation biomass measured in pounds per acre. i. Draw a graph of G against V. Include vegetation biomass levels up to 2000 pounds per acre. ii. Is the graph you found in part i concave up or concave down? Explain in practical terms what your answer means about how this kangaroo feeds. iii. There is a minimal vegetation biomass level below which the western grey kangaroo will eat nothing. Another way of expressing this is to say that the animal cannot reduce the food biomass below this level. Find this minimal level. iv. Find the satiation level for the western grey kangaroo. b. For the red kangaroo of Australia, the functional response is R=1.91.9e0.033V, Where R is the daily intake measured in pounds and V is the vegetation biomass measured in pounds per acre. i. Add the graph of R against V to the graph of G you drew in part a. ii. A simple measure of the grazing efficiency of an animal involves the minimal vegetation biomass level described above: The lower the minimal level for an animal, the more efficient it is at grazing. Which is more efficient at grazing, the western grey kangaroo or the red kangaroo?arrow_forwardWorld Crude Oil Production In 1956, M.King Hubbert proposed a model to analyse crude oil production. His model, with updated data, gives world crude oil production as P=254.43e0.042t(1+2.12e0.042t)2 Here P is measured in billions of barrels per year, and t is time, in year, since 2000. a.Make a graph of world crude oil production for 2000 through 2040. b.When does this model predict a peak in world crude oil production? c.What is the maximum crude oil production predicted by this model?arrow_forwardHydroplaning On wet roads, under certain conditions the front tires of a car will hydroplane, or run along the surface of the water. The critical speed V at which hydroplaning occurs is a function of p, the tire inflation pressure. The following table shows hypothetical data for p, in pounds per square inch, and V, in miles per hour. Tire inflation pressure p Critical speed V for hydroplaning 20 46.3 25 51.8 30 56.7 35 61.2 a Find a formula that models V as a power function of p. b In the rain, a car with tires inflated to 35pound per square inch is travelling behind a bus with tires inflated to 60 pounds per square inch, and both are moving at 65 miles per hour. If they both hit their brakes, what might happen?arrow_forward
- Algebra & Trigonometry with Analytic GeometryAlgebraISBN:9781133382119Author:SwokowskiPublisher:CengageFunctions and Change: A Modeling Approach to Coll...AlgebraISBN:9781337111348Author:Bruce Crauder, Benny Evans, Alan NoellPublisher:Cengage Learning
- Algebra and Trigonometry (MindTap Course List)AlgebraISBN:9781305071742Author:James Stewart, Lothar Redlin, Saleem WatsonPublisher:Cengage Learning