
Concept explainers
Videos
Use the graph of f in the figure to identify the following (assume that f"(0) < 0 f"(b) > 0, and f"(g) > 0):
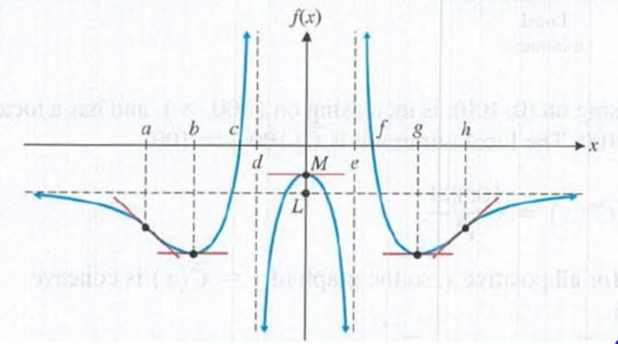
(A) the intervals on which f'(x)<0
(B) the intervals on which f'(x) > 0
(C) the intervals on which f(x) is increasing
(D) the intervals on which f(x) is decreasing
(E) the .v coordinate(s) of the point(s) where f (x) has a
(F) the x coordinate(s) of the point(s) where f(x) has a
(G) the intervals on which f"(x) < 0
(H) the intervals on which f"(x) > 0
(I) the intervals on which the graph of f is concave upward
(J) the intervals on which the graph of f is concave downward
(K) the .v coordinate(s) of the inflection point(s)
(L) the horizontal asymptote(s)
(M) the vertical asymptote(s)
Want to see the full answer?
Check out a sample textbook solution
Chapter 4 Solutions
FIN 108 ISU LOOSE >IP<


- A major company in the Montreal area, offering a range of engineering services from project preparation to construction execution, and industrial project management, wants to ensure that the individuals who are responsible for project cost estimation and bid preparation demonstrate a certain uniformity in their estimates. The head of civil engineering and municipal services decided to structure an experimental plan to detect if there could be significant differences in project evaluation. Seven projects were selected, each of which had to be evaluated by each of the two estimators, with the order of the projects submitted being random. The obtained estimates are presented in the table below. a) Complete the table above by calculating: i. The differences (A-B) ii. The sum of the differences iii. The mean of the differences iv. The standard deviation of the differences b) What is the value of the t-statistic? c) What is the critical t-value for this test at a significance level of 1%?…arrow_forwardIn the graph provided, triangle N'O'P' is the image of triangle NOP after a dilation. 104 -9- -8- 7 6 N 5 0 -4- N 3 2 1 -10 -9 -8 -7 -6 -5 -4 -3 -2 -1 1 2 3 4 5 6 7 8 9 10 -1 -2 -3 -4 p -5 -6 -7 -8 Xarrow_forwardmv2 The centripetal force of an object of mass m is given by F (r) = rotation and r is the distance from the center of rotation. ' where v is the speed of r a. Find the rate of change of centripetal force with respect to the distance from the center of rotation. F(r) b. Find the rate of change of centripetal force of an object with mass 500 kilograms, velocity of 13.86 m/s, and a distance from the center of rotation of 300 meters. Round to 2 decimal places. N/m (or kg/s²) F' (300)arrow_forward
- 104 8 6 4 G G 2 F -10 -8 -6 -4 -2 0 2 4 6 8 10 N H -4 H 6 8 10arrow_forwardThe coordinates of AABC are shown on the coordinate plane provided. AABC is dilated from the origin by scale factor r=2. 2 3 -2 0 1 2 2 m 17arrow_forwardIn the diagram provided, AABC-AAPQ. Read each statement and then arrange the true/false statements in order. B P A Carrow_forward
- Compute the relative risk of falling for the two groups (did not stop walking vs. did stop). State/interpret your result verbally.arrow_forwardnot use ai pleasearrow_forwardlearn.edgenuity : C&C VIP Unit Test Unit Test Review Active 1 2 3 4 Which statement is true about the graph of the equation y = csc¯¹(x)? There is a horizontal asymptote at y = 0. उद There is a horizontal asymptote at y = 2. There is a vertical asymptote at x = 0. O There is a vertical asymptote at x=- R Mark this and return C Save and Exit emiarrow_forward
- Please helparrow_forwardMicrosoft Excel include formulasarrow_forwardQuestion 1 The data shown in Table 1 are and R values for 24 samples of size n = 5 taken from a process producing bearings. The measurements are made on the inside diameter of the bearing, with only the last three decimals recorded (i.e., 34.5 should be 0.50345). Table 1: Bearing Diameter Data Sample Number I R Sample Number I R 1 34.5 3 13 35.4 8 2 34.2 4 14 34.0 6 3 31.6 4 15 37.1 5 4 31.5 4 16 34.9 7 5 35.0 5 17 33.5 4 6 34.1 6 18 31.7 3 7 32.6 4 19 34.0 8 8 33.8 3 20 35.1 9 34.8 7 21 33.7 2 10 33.6 8 22 32.8 1 11 31.9 3 23 33.5 3 12 38.6 9 24 34.2 2 (a) Set up and R charts on this process. Does the process seem to be in statistical control? If necessary, revise the trial control limits. [15 pts] (b) If specifications on this diameter are 0.5030±0.0010, find the percentage of nonconforming bearings pro- duced by this process. Assume that diameter is normally distributed. [10 pts] 1arrow_forward
 Algebra & Trigonometry with Analytic GeometryAlgebraISBN:9781133382119Author:SwokowskiPublisher:Cengage
 College Algebra (MindTap Course List)AlgebraISBN:9781305652231Author:R. David Gustafson, Jeff HughesPublisher:Cengage Learning
 College AlgebraAlgebraISBN:9781305115545Author:James Stewart, Lothar Redlin, Saleem WatsonPublisher:Cengage Learning
 Algebra: Structure And Method, Book 1AlgebraISBN:9780395977224Author:Richard G. Brown, Mary P. Dolciani, Robert H. Sorgenfrey, William L. ColePublisher:McDougal Littell