
Modern Business Statistics with Microsoft Office Excel (with XLSTAT Education Edition Printed Access Card) (MindTap Course List)
6th Edition
ISBN: 9781337115186
Author: David R. Anderson, Dennis J. Sweeney, Thomas A. Williams, Jeffrey D. Camm, James J. Cochran
Publisher: Cengage Learning
expand_more
expand_more
format_list_bulleted
Concept explainers
Videos
Textbook Question
Chapter 4.4, Problem 38E
The Institute for Higher Education Policy, a Washington, D.C.-based research firm, studied the payback of student loans for 1.8 million college students who had student loans that began to become due six years ago (The Wall Street Journal, November 27, 2012). The study found that 50% of the student loans were being paid back in a satisfactory fashion, whereas 50% of the student loans were delinquent. The following joint
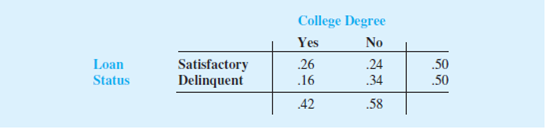
- a. What is the probability that a student with a student loan had received a college degree?
- b. What is the probability that a student with a student loan had not received a college degree?
- c. Given the student had received a college degree, what is the probability that the student has a delinquent loan?
- d. Given the student had not received a college degree, what is the probability that the student has a delinquent loan?
- e. What is the impact of dropping out of college without a degree for students who have a student loan?
Expert Solution & Answer
Want to see the full answer?
Check out a sample textbook solution
Students have asked these similar questions
08:34
◄ Classroom
07:59
Probs. 5-32/33
D
ا.
89
5-34. Determine the horizontal and vertical components
of reaction at the pin A and the normal force at the smooth
peg B on the member.
A
0,4 m
0.4 m
Prob. 5-34
F=600 N
fr
th
ar
0.
163586
5-37. The wooden plank resting between the buildings
deflects slightly when it supports the 50-kg boy. This
deflection causes a triangular distribution of load at its ends.
having maximum intensities of w, and wg. Determine w
and wg. each measured in N/m. when the boy is standing
3 m from one end as shown. Neglect the mass of the plank.
0.45 m
3 m
Examine the Variables: Carefully review and note the names of all variables in the dataset. Examples of these variables include:
Mileage (mpg)
Number of Cylinders (cyl)
Displacement (disp)
Horsepower (hp)
Research: Google to understand these variables.
Statistical Analysis: Select mpg variable, and perform the following statistical tests. Once you are done with these tests using mpg variable, repeat the same with hp
Mean
Median
First Quartile (Q1)
Second Quartile (Q2)
Third Quartile (Q3)
Fourth Quartile (Q4)
10th Percentile
70th Percentile
Skewness
Kurtosis
Document Your Results:
In RStudio: Before running each statistical test, provide a heading in the format shown at the bottom. “# Mean of mileage – Your name’s command”
In Microsoft Word: Once you've completed all tests, take a screenshot of your results in RStudio and paste it into a Microsoft Word document. Make sure that snapshots are very clear. You will need multiple snapshots. Also transfer these results to the…
Chapter 4 Solutions
Modern Business Statistics with Microsoft Office Excel (with XLSTAT Education Edition Printed Access Card) (MindTap Course List)
Ch. 4.1 - 1. An experiment has three steps with three...Ch. 4.1 - 2. How many ways can three items be selected from...Ch. 4.1 - 3. How many permutations of three items can be...Ch. 4.1 - Prob. 4ECh. 4.1 - 5. Suppose an experiment has five equally likely...Ch. 4.1 - Prob. 6ECh. 4.1 - Prob. 7ECh. 4.1 - 8. In the city of Milford, applications for zoning...Ch. 4.1 - Prob. 9ECh. 4.1 - 10. The following table shows the percentage of...
Ch. 4.1 - Tri-State Smokers. A Gallup Poll of U.S. adults...Ch. 4.1 - 12. The Powerball lottery is played twice each...Ch. 4.1 - 13. A company that manufactures toothpaste is...Ch. 4.2 - 14. An experiment has four equally likely...Ch. 4.2 - 15. Consider the experiment of selecting a playing...Ch. 4.2 - 16. Consider the experiment of rolling a pair of...Ch. 4.2 - 17. Refer to the KP&L sample points and sample...Ch. 4.2 - Prob. 18ECh. 4.2 - 19. Do you think global warming will have an...Ch. 4.2 - 20. Junior Achievement USA and the Allstate...Ch. 4.2 - 21. Data on U.S. work-related fatalities by cause...Ch. 4.3 - 22. Suppose that we have a sample space with five...Ch. 4.3 - Prob. 23ECh. 4.3 - Prob. 24ECh. 4.3 - 25. The Eco Pulse survey from the marketing...Ch. 4.3 - Prob. 26ECh. 4.3 - Social Media Use. A marketing firm would like to...Ch. 4.3 - 28. A survey of magazine subscribers showed that...Ch. 4.3 - 29. High school seniors with strong academic...Ch. 4.4 - 30. Suppose that we have two events, A and B, with...Ch. 4.4 - 31. Assume that we have two events, A and B, that...Ch. 4.4 - Living with Family. Consider the following example...Ch. 4.4 -
Students taking the Graduate Management...Ch. 4.4 - Prob. 34ECh. 4.4 - 35. To better understand how husbands and wives...Ch. 4.4 - 36. Jamal Crawford of the National Basketball...Ch. 4.4 - 37. A joint survey by Parade magazine and Yahoo!...Ch. 4.4 - 38. The Institute for Higher Education Policy, a...Ch. 4.5 - 39. The prior probabilities for events A1 and A2...Ch. 4.5 - 40. The prior probabilities for events A1, A2, and...Ch. 4.5 - 41. A consulting firm submitted a bid for a large...Ch. 4.5 - Prob. 42ECh. 4.5 - 43. In August 2012, tropical storm Isaac formed in...Ch. 4.5 - Prob. 44ECh. 4.5 - 45. The percentage of adult users of the Internet...Ch. 4 - 46. A survey of adults aged 18 and older conducted...Ch. 4 - Prob. 47SECh. 4 -
Below are the results of a survey of 1364...Ch. 4 - 49. A study of 31,000 hospital admissions in New...Ch. 4 - 50. A telephone survey to determine viewer...Ch. 4 - 51. The U.S. Census Bureau serves as the leading...Ch. 4 - 52. An MBA new-matriculants survey provided the...Ch. 4 - Prob. 53SECh. 4 - 54. In February 2012, the Pew Internet & American...Ch. 4 - 55. A large consumer goods company ran a...Ch. 4 - Prob. 56SECh. 4 - 57. A company studied the number of lost-time...Ch. 4 - Prob. 58SECh. 4 - 59. An oil company purchased an option on land in...Ch. 4 - 60. The five most common words appearing in spam...Ch. 4 - Rob’s Market (RM) is a regional food store chain...
Knowledge Booster


Learn more about
Need a deep-dive on the concept behind this application? Look no further. Learn more about this topic, statistics and related others by exploring similar questions and additional content below.Similar questions
- Examine the Variables: Carefully review and note the names of all variables in the dataset. Examples of these variables include: Mileage (mpg) Number of Cylinders (cyl) Displacement (disp) Horsepower (hp) Research: Google to understand these variables. Statistical Analysis: Select mpg variable, and perform the following statistical tests. Once you are done with these tests using mpg variable, repeat the same with hp Mean Median First Quartile (Q1) Second Quartile (Q2) Third Quartile (Q3) Fourth Quartile (Q4) 10th Percentile 70th Percentile Skewness Kurtosis Document Your Results: In RStudio: Before running each statistical test, provide a heading in the format shown at the bottom. “# Mean of mileage – Your name’s command” In Microsoft Word: Once you've completed all tests, take a screenshot of your results in RStudio and paste it into a Microsoft Word document. Make sure that snapshots are very clear. You will need multiple snapshots. Also transfer these results to the…arrow_forward2 (VaR and ES) Suppose X1 are independent. Prove that ~ Unif[-0.5, 0.5] and X2 VaRa (X1X2) < VaRa(X1) + VaRa (X2). ~ Unif[-0.5, 0.5]arrow_forward8 (Correlation and Diversification) Assume we have two stocks, A and B, show that a particular combination of the two stocks produce a risk-free portfolio when the correlation between the return of A and B is -1.arrow_forward
- 9 (Portfolio allocation) Suppose R₁ and R2 are returns of 2 assets and with expected return and variance respectively r₁ and 72 and variance-covariance σ2, 0%½ and σ12. Find −∞ ≤ w ≤ ∞ such that the portfolio wR₁ + (1 - w) R₂ has the smallest risk.arrow_forward7 (Multivariate random variable) Suppose X, €1, €2, €3 are IID N(0, 1) and Y2 Y₁ = 0.2 0.8X + €1, Y₂ = 0.3 +0.7X+ €2, Y3 = 0.2 + 0.9X + €3. = (In models like this, X is called the common factors of Y₁, Y₂, Y3.) Y = (Y1, Y2, Y3). (a) Find E(Y) and cov(Y). (b) What can you observe from cov(Y). Writearrow_forward1 (VaR and ES) Suppose X ~ f(x) with 1+x, if 0> x > −1 f(x) = 1−x if 1 x > 0 Find VaRo.05 (X) and ES0.05 (X).arrow_forward
- Joy is making Christmas gifts. She has 6 1/12 feet of yarn and will need 4 1/4 to complete our project. How much yarn will she have left over compute this solution in two different ways arrow_forwardSolve for X. Explain each step. 2^2x • 2^-4=8arrow_forwardOne hundred people were surveyed, and one question pertained to their educational background. The results of this question and their genders are given in the following table. Female (F) Male (F′) Total College degree (D) 30 20 50 No college degree (D′) 30 20 50 Total 60 40 100 If a person is selected at random from those surveyed, find the probability of each of the following events.1. The person is female or has a college degree. Answer: equation editor Equation Editor 2. The person is male or does not have a college degree. Answer: equation editor Equation Editor 3. The person is female or does not have a college degree.arrow_forward
arrow_back_ios
SEE MORE QUESTIONS
arrow_forward_ios
Recommended textbooks for you
 Holt Mcdougal Larson Pre-algebra: Student Edition...AlgebraISBN:9780547587776Author:HOLT MCDOUGALPublisher:HOLT MCDOUGAL

Holt Mcdougal Larson Pre-algebra: Student Edition...
Algebra
ISBN:9780547587776
Author:HOLT MCDOUGAL
Publisher:HOLT MCDOUGAL
Statistics 4.1 Point Estimators; Author: Dr. Jack L. Jackson II;https://www.youtube.com/watch?v=2MrI0J8XCEE;License: Standard YouTube License, CC-BY
Statistics 101: Point Estimators; Author: Brandon Foltz;https://www.youtube.com/watch?v=4v41z3HwLaM;License: Standard YouTube License, CC-BY
Central limit theorem; Author: 365 Data Science;https://www.youtube.com/watch?v=b5xQmk9veZ4;License: Standard YouTube License, CC-BY
Point Estimate Definition & Example; Author: Prof. Essa;https://www.youtube.com/watch?v=OTVwtvQmSn0;License: Standard Youtube License
Point Estimation; Author: Vamsidhar Ambatipudi;https://www.youtube.com/watch?v=flqhlM2bZWc;License: Standard Youtube License