
Statistical Reasoning for Everyday Life (5th Edition)
5th Edition
ISBN: 9780134494043
Author: Jeff Bennett, William L. Briggs, Mario F. Triola
Publisher: PEARSON
expand_more
expand_more
format_list_bulleted
Concept explainers
Videos
Textbook Question
Chapter 4.4, Problem 16E
Better Drug. Two drugs, A and B, were tested on a total of 2000 patients, half of whom were women and half of whom were men. Drug A was given to 900 patients and Drug B to 1100 patients. The results appear in the following table.
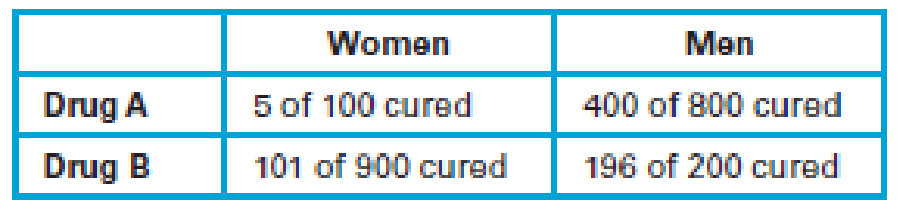
- a. Give numerical evidence to support the claim that Drug B is more effective than Drug A.
- b. Give numerical evidence to support the claim that Drug A is more effective than Drug B.
- c. Which claim do you think makes more sense? Why?
Expert Solution & Answer
Want to see the full answer?
Check out a sample textbook solution
Students have asked these similar questions
The following are suggested designs for group sequential studies. Using PROCSEQDESIGN, provide the following for the design O’Brien Fleming and Pocock.• The critical boundary values for each analysis of the data• The expected sample sizes at each interim analysisAssume the standardized Z score method for calculating boundaries.Investigators are evaluating the success rate of a novel drug for treating a certain type ofbacterial wound infection. Since no existing treatment exists, they have planned a one-armstudy. They wish to test whether the success rate of the drug is better than 50%, whichthey have defined as the null success rate. Preliminary testing has estimated the successrate of the drug at 55%. The investigators are eager to get the drug into production andwould like to plan for 9 interim analyses (10 analyzes in total) of the data. Assume thesignificance level is 5% and power is 90%.Besides, draw a combined boundary plot (OBF, POC, and HP)
Please provide the solution for the attached image in detailed.
20 km, because
GISS
Worksheet 10
Jesse runs a small business selling and delivering mealie meal to the spaza shops.
He charges a fixed rate of R80, 00 for delivery and then R15, 50 for each packet of
mealle meal he delivers. The table below helps him to calculate what to charge
his customers.
10
20
30
40
50
Packets of mealie
meal (m)
Total costs in Rands
80
235
390
545
700
855
(c)
10.1.
Define the following terms:
10.1.1. Independent Variables
10.1.2. Dependent Variables
10.2.
10.3.
10.4.
10.5.
Determine the independent and dependent variables.
Are the variables in this scenario discrete or continuous values? Explain
What shape do you expect the graph to be? Why?
Draw a graph on the graph provided to represent the information in the
table above.
TOTAL COST OF PACKETS OF MEALIE MEAL
900
800
700
600
COST (R)
500
400
300
200
100
0
10
20
30
40
60
NUMBER OF PACKETS OF MEALIE MEAL
Chapter 4 Solutions
Statistical Reasoning for Everyday Life (5th Edition)
Ch. 4.1 - Average. Define and distinguish among mean,...Ch. 4.1 - Outliers. What are outliers? Describe the effects...Ch. 4.1 - Average Confusion. Briefly describe at least two...Ch. 4.1 - Weighting. What is a weighted mean, and when is it...Ch. 4.1 - Does It Make Sense? For Exercises 59, determine...Ch. 4.1 - Does It Make Sense? For Exercises 59, determine...Ch. 4.1 - Mode. In an analysis of salaries paid to sales...Ch. 4.1 - Employment Data. A survey asked people their...Ch. 4.1 - Mean Wage. To find the mean wage of restaurant...Ch. 4.1 - Mean, Median, and Mode. In Exercises 1016, find...
Ch. 4.1 - Mean, Median, and Mode. In Exercises 1016, find...Ch. 4.1 - Mean, Median, and Mode. In Exercises 1016, find...Ch. 4.1 - Mean, Median, and Mode. In Exercises 1016, find...Ch. 4.1 - Mean, Median, and Mode. In Exercises 1016, find...Ch. 4.1 - Mean, Median, and Mode. In Exercises 1016, find...Ch. 4.1 - Mean, Median, and Mode. In Exercises 1016, find...Ch. 4.1 - Cell Phone Radiation. Listed below are...Ch. 4.1 - Alphabetic States. The states of Alabama, Alaska,...Ch. 4.1 - Outlier Coke. The contents of cans of regular...Ch. 4.1 - Raising Your Grade. Suppose you have scores of 80,...Ch. 4.1 - Raising Your Grade. Suppose you have scores of 60,...Ch. 4.1 - Comparing Data. In Exercises 2225, find the mean...Ch. 4.1 - Comparing Data. In Exercises 2225, find the mean...Ch. 4.1 - Comparing Data. In Exercises 2225, find the mean...Ch. 4.1 - Prob. 25ECh. 4.1 - Weighted Mean. Compute the weighte means in...Ch. 4.1 - Class Grade. Ryan is taking an advanced math class...Ch. 4.1 - GPA. One common system for computing a grade point...Ch. 4.1 - Prob. 29ECh. 4.1 - Prob. 30ECh. 4.1 - 31. Stockholder Voting. A small company has six...Ch. 4.1 - Weighted Mean. In Exercises 3235, find the mean of...Ch. 4.1 - Weighted Mean. In Exercises 3235, find the mean of...Ch. 4.1 - Weighted Mean. In Exercises 3235, find the mean of...Ch. 4.1 - Weighted Mean. In Exercises 3235, find the mean of...Ch. 4.1 - U.S. Population Center. Imagine taking a huge flat...Ch. 4.2 - Modes. Distinguish between a uniform distribution...Ch. 4.2 - Prob. 2ECh. 4.2 - Prob. 3ECh. 4.2 - Prob. 4ECh. 4.2 - Prob. 5ECh. 4.2 - Does It Make Sense? For Exercises 58, determine...Ch. 4.2 - Does It Make Sense? For Exercises 58, determine...Ch. 4.2 - Does It Make Sense? For Exercises 58, determine...Ch. 4.2 - Prob. 9ECh. 4.2 - Distributions. In Exercises 912, describe the...Ch. 4.2 - Distributions. In Exercises 912, describe the...Ch. 4.2 - Distributions. In Exercises 912, describe the...Ch. 4.2 - Baseball Salaries. In a recent year, the 868...Ch. 4.2 - Boston Rainfall. The daily rainfall amounts (in...Ch. 4.2 - Describing Distributions. For each distribution...Ch. 4.2 - Describing Distributions. For each distribution...Ch. 4.2 - Describing Distributions. For each distribution...Ch. 4.2 - Describing Distributions. For each distribution...Ch. 4.2 - Describing Distributions. For each distribution...Ch. 4.2 - Describing Distributions. For each distribution...Ch. 4.2 - Describing Distributions. For each distribution...Ch. 4.2 - Describing Distributions. For each distribution...Ch. 4.2 - Describing Distributions. For each distribution...Ch. 4.2 - Describing Distributions. For each distribution...Ch. 4.2 - Describing Distributions. For each distribution...Ch. 4.2 - Describing Distributions. For each distribution...Ch. 4.3 - Variation Matters. Consider two grocery stores at...Ch. 4.3 - Variation Measures. Briefly distinguish between...Ch. 4.3 - Quartiles and Percentiles. Briefly describe how...Ch. 4.3 - Standard Deviation. Describe the process of...Ch. 4.3 - Does It Make Sense? For Exercises 58, determine...Ch. 4.3 - Does It Make Sense? For Exercises 58, determine...Ch. 4.3 - Does It Make Sense? For Exercises 58, determine...Ch. 4.3 - Does It Make Sense? For Exercises 58, determine...Ch. 4.3 - Prob. 9ECh. 4.3 - Range and Standard Deviation. Exercises 916 each...Ch. 4.3 - Range and Standard Deviation. Exercises 916 each...Ch. 4.3 - Range and Standard Deviation. Exercises 916 each...Ch. 4.3 - Range and Standard Deviation. Exercises 916 each...Ch. 4.3 - Range and Standard Deviation. Exercises 916 each...Ch. 4.3 - Range and Standard Deviation. Exercises 916 each...Ch. 4.3 - Range and Standard Deviation. Exercises 916 each...Ch. 4.3 - Prob. 17ECh. 4.3 - Comparing Variation. In Exercises 1720, find the...Ch. 4.3 - Prob. 19ECh. 4.3 - Comparing Variation. In Exercises 1720, find the...Ch. 4.3 - Calculating Percentiles. A statistics professor...Ch. 4.3 - Calculating Percentiles. A data set consists of...Ch. 4.3 - Understanding Standard Deviation. The following...Ch. 4.3 - Understanding Standard Deviation. The following...Ch. 4.3 - Comparing Data Sets. For each of Exercises 2528,...Ch. 4.3 - Comparing Data Sets. For each of Exercises 2528,...Ch. 4.3 - Comparing Data Sets. For each of Exercises 2528,...Ch. 4.3 - Comparing Data Sets. For each of Exercises 2528,...Ch. 4.3 - Manufacturing. You are in charge of a...Ch. 4.3 - Prob. 30ECh. 4.3 - Prob. 31ECh. 4.3 - Prob. 32ECh. 4.4 - False Positive and False Negative. Professional...Ch. 4.4 - Positive Test Result. A professional soccer player...Ch. 4.4 - Prob. 3ECh. 4.4 - Prob. 4ECh. 4.4 - Does It Make Sense? For Exercises 58, determine...Ch. 4.4 - Does It Make Sense? For Exercises 58, determine...Ch. 4.4 - Does It Make Sense? For Exercises 58, determine...Ch. 4.4 - Does It Make Sense? For Exercises 58, determine...Ch. 4.4 - Prob. 9ECh. 4.4 - Passing Percentages. The table below shows the...Ch. 4.4 - Test Scores. The table below shows eighth-grade...Ch. 4.4 - Test Scores. Consider the following table...Ch. 4.4 - Prob. 13ECh. 4.4 - Prob. 14ECh. 4.4 - Basketball Records. Consider the following...Ch. 4.4 - Better Drug. Two drugs, A and B, were tested on a...Ch. 4.4 - Prob. 17ECh. 4.4 - Disease Test. Suppose a test for a disease is 80%...Ch. 4.4 - Prob. 19ECh. 4.4 - Drug Trials. (This problem is based on an example...Ch. 4.4 - HIV Risks. The New York State Department of Health...Ch. 4 - Chocolate Chips. Listed below are counts of the...Ch. 4 - Prob. 2CRECh. 4 - a. What is the standard deviation for a data set...Ch. 4 - When you add the earthquake magnitudes 2.45, 3.62,...Ch. 4 - Prob. 2CQCh. 4 - Prob. 3CQCh. 4 - Prob. 4CQCh. 4 - Prob. 5CQCh. 4 - Prob. 6CQCh. 4 - A histogram is constructed for a large set of...Ch. 4 - Prob. 8CQCh. 4 - Prob. 9CQCh. 4 - Identify the names of the components that...
Knowledge Booster


Learn more about
Need a deep-dive on the concept behind this application? Look no further. Learn more about this topic, statistics and related others by exploring similar questions and additional content below.Similar questions
- Let X be a random variable with support SX = {−3, 0.5, 3, −2.5, 3.5}. Part ofits probability mass function (PMF) is given bypX(−3) = 0.15, pX(−2.5) = 0.3, pX(3) = 0.2, pX(3.5) = 0.15.(a) Find pX(0.5).(b) Find the cumulative distribution function (CDF), FX(x), of X.1(c) Sketch the graph of FX(x).arrow_forwardA well-known company predominantly makes flat pack furniture for students. Variability with the automated machinery means the wood components are cut with a standard deviation in length of 0.45 mm. After they are cut the components are measured. If their length is more than 1.2 mm from the required length, the components are rejected. a) Calculate the percentage of components that get rejected. b) In a manufacturing run of 1000 units, how many are expected to be rejected? c) The company wishes to install more accurate equipment in order to reduce the rejection rate by one-half, using the same ±1.2mm rejection criterion. Calculate the maximum acceptable standard deviation of the new process.arrow_forward5. Let X and Y be independent random variables and let the superscripts denote symmetrization (recall Sect. 3.6). Show that (X + Y) X+ys.arrow_forward
- 8. Suppose that the moments of the random variable X are constant, that is, suppose that EX" =c for all n ≥ 1, for some constant c. Find the distribution of X.arrow_forward9. The concentration function of a random variable X is defined as Qx(h) = sup P(x ≤ X ≤x+h), h>0. Show that, if X and Y are independent random variables, then Qx+y (h) min{Qx(h). Qr (h)).arrow_forward10. Prove that, if (t)=1+0(12) as asf->> O is a characteristic function, then p = 1.arrow_forward
- 9. The concentration function of a random variable X is defined as Qx(h) sup P(x ≤x≤x+h), h>0. (b) Is it true that Qx(ah) =aQx (h)?arrow_forward3. Let X1, X2,..., X, be independent, Exp(1)-distributed random variables, and set V₁₁ = max Xk and W₁ = X₁+x+x+ Isk≤narrow_forward7. Consider the function (t)=(1+|t|)e, ER. (a) Prove that is a characteristic function. (b) Prove that the corresponding distribution is absolutely continuous. (c) Prove, departing from itself, that the distribution has finite mean and variance. (d) Prove, without computation, that the mean equals 0. (e) Compute the density.arrow_forward
- 1. Show, by using characteristic, or moment generating functions, that if fx(x) = ½ex, -∞0 < x < ∞, then XY₁ - Y2, where Y₁ and Y2 are independent, exponentially distributed random variables.arrow_forward1. Show, by using characteristic, or moment generating functions, that if 1 fx(x): x) = ½exarrow_forward1990) 02-02 50% mesob berceus +7 What's the probability of getting more than 1 head on 10 flips of a fair coin?arrow_forward
arrow_back_ios
SEE MORE QUESTIONS
arrow_forward_ios
Recommended textbooks for you
 Glencoe Algebra 1, Student Edition, 9780079039897...AlgebraISBN:9780079039897Author:CarterPublisher:McGraw Hill
 Holt Mcdougal Larson Pre-algebra: Student Edition...AlgebraISBN:9780547587776Author:HOLT MCDOUGALPublisher:HOLT MCDOUGAL
 Big Ideas Math A Bridge To Success Algebra 1: Stu...AlgebraISBN:9781680331141Author:HOUGHTON MIFFLIN HARCOURTPublisher:Houghton Mifflin Harcourt
Glencoe Algebra 1, Student Edition, 9780079039897...
Algebra
ISBN:9780079039897
Author:Carter
Publisher:McGraw Hill
Holt Mcdougal Larson Pre-algebra: Student Edition...
Algebra
ISBN:9780547587776
Author:HOLT MCDOUGAL
Publisher:HOLT MCDOUGAL
Big Ideas Math A Bridge To Success Algebra 1: Stu...
Algebra
ISBN:9781680331141
Author:HOUGHTON MIFFLIN HARCOURT
Publisher:Houghton Mifflin Harcourt
Statistics 4.1 Introduction to Inferential Statistics; Author: Dr. Jack L. Jackson II;https://www.youtube.com/watch?v=QLo4TEvBvK4;License: Standard YouTube License, CC-BY