Concept explainers
Videos
DRAW IT (a) Estimate the average CO2 concentration in 1975 and in 2012 using the data provided in Figure 43.25. (b) On average, how rapidly did CO2 concentrations increase (ppm/yr) from 1975 to 2012? (c) Estimate the approximate CO2 concentration in 2100, assuming that the CO2 concentration continues to rise as fast as it did from 1975 to 2012. (d) Draw a graph of average CO2 concentration from 1975 to 2012 and then use a dashed line to extend the graph to the year 2100. (e) Identify the ecological factors and human decisions that might influence the actual rise in CO2 concentration. (f) Discuss how additional scientific data could help societies predict this value.
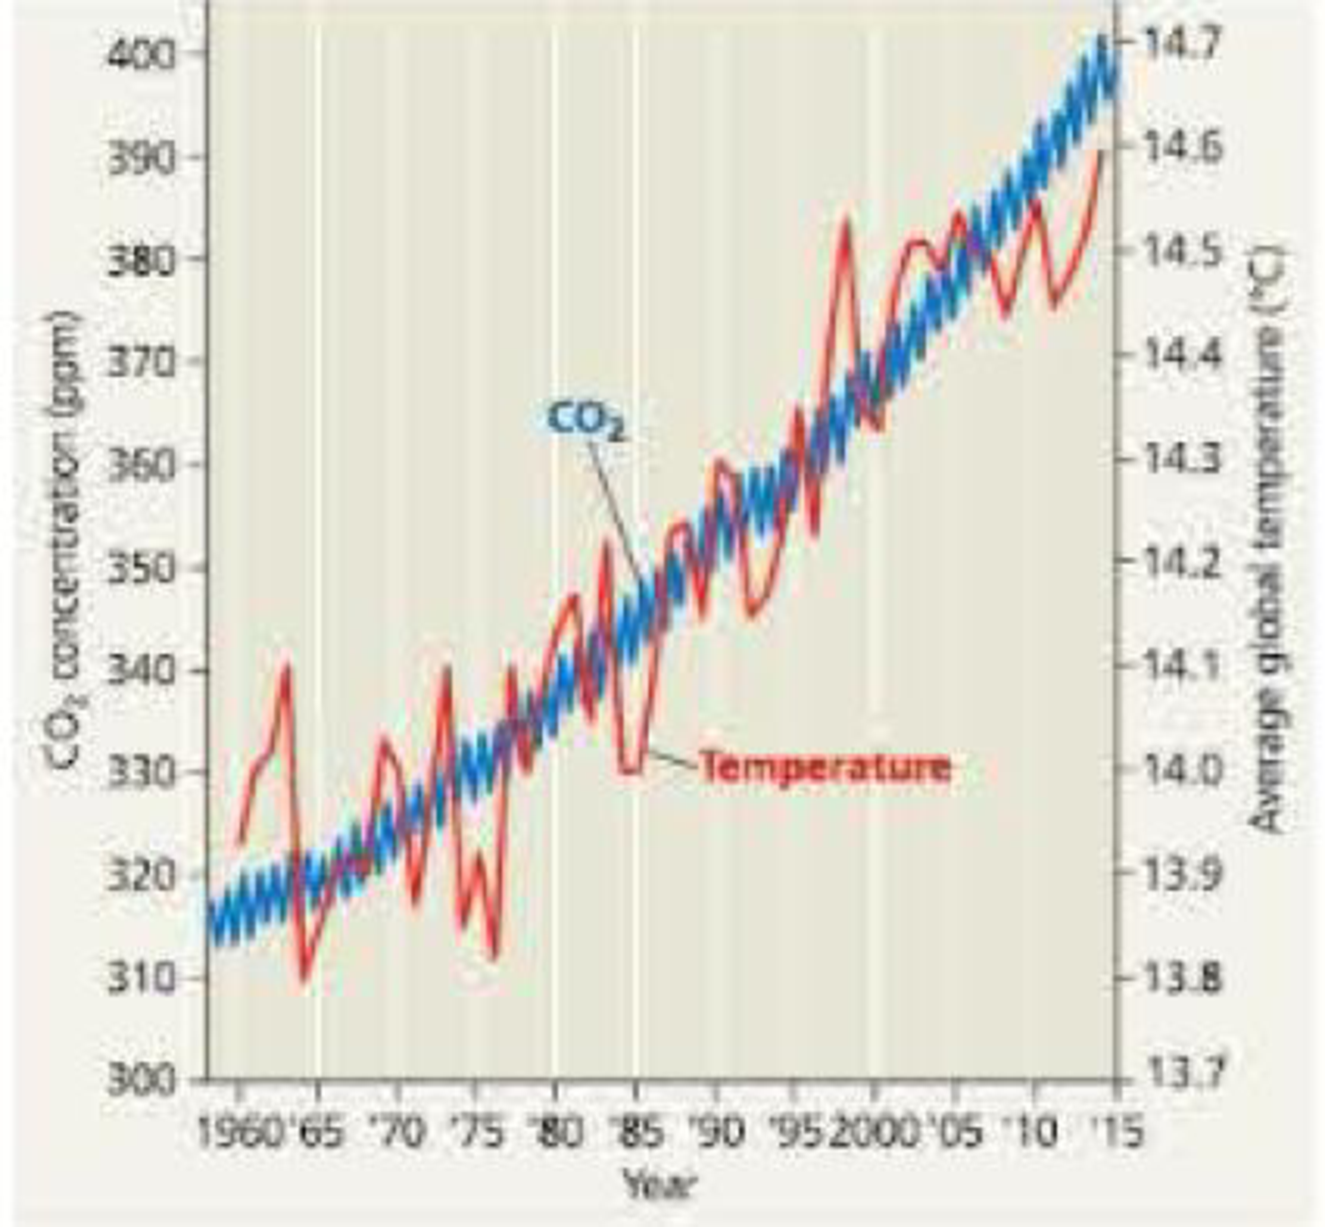
Figure 43.25 Increase in atmospheric carbon dioxide concentration at Mauna Loa, Hawaii, and average global temperatures.
Want to see the full answer?
Check out a sample textbook solution
Chapter 43 Solutions
Campbell Biology in Focus (2nd Edition)


- Identify the indicated structure (Saprolegnia). a. antheridium O b. oospore c.sperm d. auxospore e. tetraspore Of. zygosporearrow_forwardUsing information from the primary literature (several references have been provided as a starting point below) please answer the following question: Based on your review of the literature on rewilding, what are the major scientific pros and cons for rewilding? Please note that the focus of this assignment are the (biological) scientific issues associated with rewilding. As will be discussed in class, there are a number of non-scientific issues involved or implicated in rewilding, all ultimately affecting the public acceptability of rewilding. Although these issues are important – indeed, critical – in this assignment you should focus on the biological science issues and questions. Details: You must enumerate at least two pros and at least two cons. Your answer should be no more than 500 well-chosen words, excluding references. Think carefully about how best to organize and structure your answer. Aim for high information density: say a lot, but say it succinctly. Recall Nietzche’s…arrow_forwardUsing information from the primary literature (several references have been provided as a starting point below) please answer the following question: Based on your review of the literature on rewilding, what are the major scientific pros and cons for rewilding? Please note that the focus of this assignment are the (biological) scientific issues associated with rewilding. As will be discussed in class, there are a number of non-scientific issues involved or implicated in rewilding, all ultimately affecting the public acceptability of rewilding. Although these issues are important – indeed, critical – in this assignment you should focus on the biological science issues and questions. Details: You must enumerate at least two pros and at least two cons. Your answer should be no more than 500 well-chosen words, excluding references. Think carefully about how best to organize and structure your answer. Aim for high information density: say a lot, but say it succinctly. Recall Nietzche’s…arrow_forward
- Now draw a rough sketch of what the control data might look like if in addition to the specific binding, there was also a considerable amount of nonspecific binding (again using a normal dose/response curve) (do % total bound ligand vs concentration)arrow_forwardWhat are functions of cuboidal cells in the kidney? Select all that apply. Concentration of gases Dilution of chemicals Secretion of molecules Nutrition to tissues Support of tissues Absorption of moleculesarrow_forwardquestion1 In plants, epithelial tissue is only found as the outermost cell layer and acts as a barrier. In humans, epithelial tissue is found inside the body as well as on the surface. What function(s) does/do epithelial tissue carry out in humans? Select all that apply. Waste storage Filtration Oxygen transport Protection Diffusion Osmosis Absorptionarrow_forward
- What words best describes this organism? a. Unicellular/nonmotile Ob. unicellular/motile c. colonial/nonmotile d. colonial/motile e. multicelluar O f. siphonous g. none of thesearrow_forwardIdentify the phylum or class. a. Euglenophyta b. Dinoflagellata c. Bacillariophyceae d. Oomycetes e. Phaeophyceae O f. Myxomycota g. Xanthophyceae ○ h. Chrysophyceae i. Dictyosteliomycota O j. Rhodophyta Ok. Chlorophyceaens I. Charophyceaensarrow_forwardWhat is produced inside the indicated structure (Fucus). a. eggs O b. antheridia ○ c. sperm d. zygotes e. none of thesearrow_forward
 Comprehensive Medical Assisting: Administrative a...NursingISBN:9781305964792Author:Wilburta Q. Lindh, Carol D. Tamparo, Barbara M. Dahl, Julie Morris, Cindy CorreaPublisher:Cengage Learning
 Human Biology (MindTap Course List)BiologyISBN:9781305112100Author:Cecie Starr, Beverly McMillanPublisher:Cengage Learning
- Case Studies In Health Information ManagementBiologyISBN:9781337676908Author:SCHNERINGPublisher:Cengage
 Biology 2eBiologyISBN:9781947172517Author:Matthew Douglas, Jung Choi, Mary Ann ClarkPublisher:OpenStax
 Biology: The Unity and Diversity of Life (MindTap...BiologyISBN:9781305073951Author:Cecie Starr, Ralph Taggart, Christine Evers, Lisa StarrPublisher:Cengage Learning