
Introduction To Statistics And Data Analysis
6th Edition
ISBN: 9781337793612
Author: PECK, Roxy.
Publisher: Cengage Learning,
expand_more
expand_more
format_list_bulleted
Concept explainers
Videos
Textbook Question
Chapter 4.3, Problem 37E
The U.S. Department of Health and Human Services reported the estimated percentage of U.S. households with only wireless phone service (no landline) in 2014 for the 50 states and the District of Columbia (cdc.gov/nchs/data/nhis/earlyrelease/wireless_state_201602.
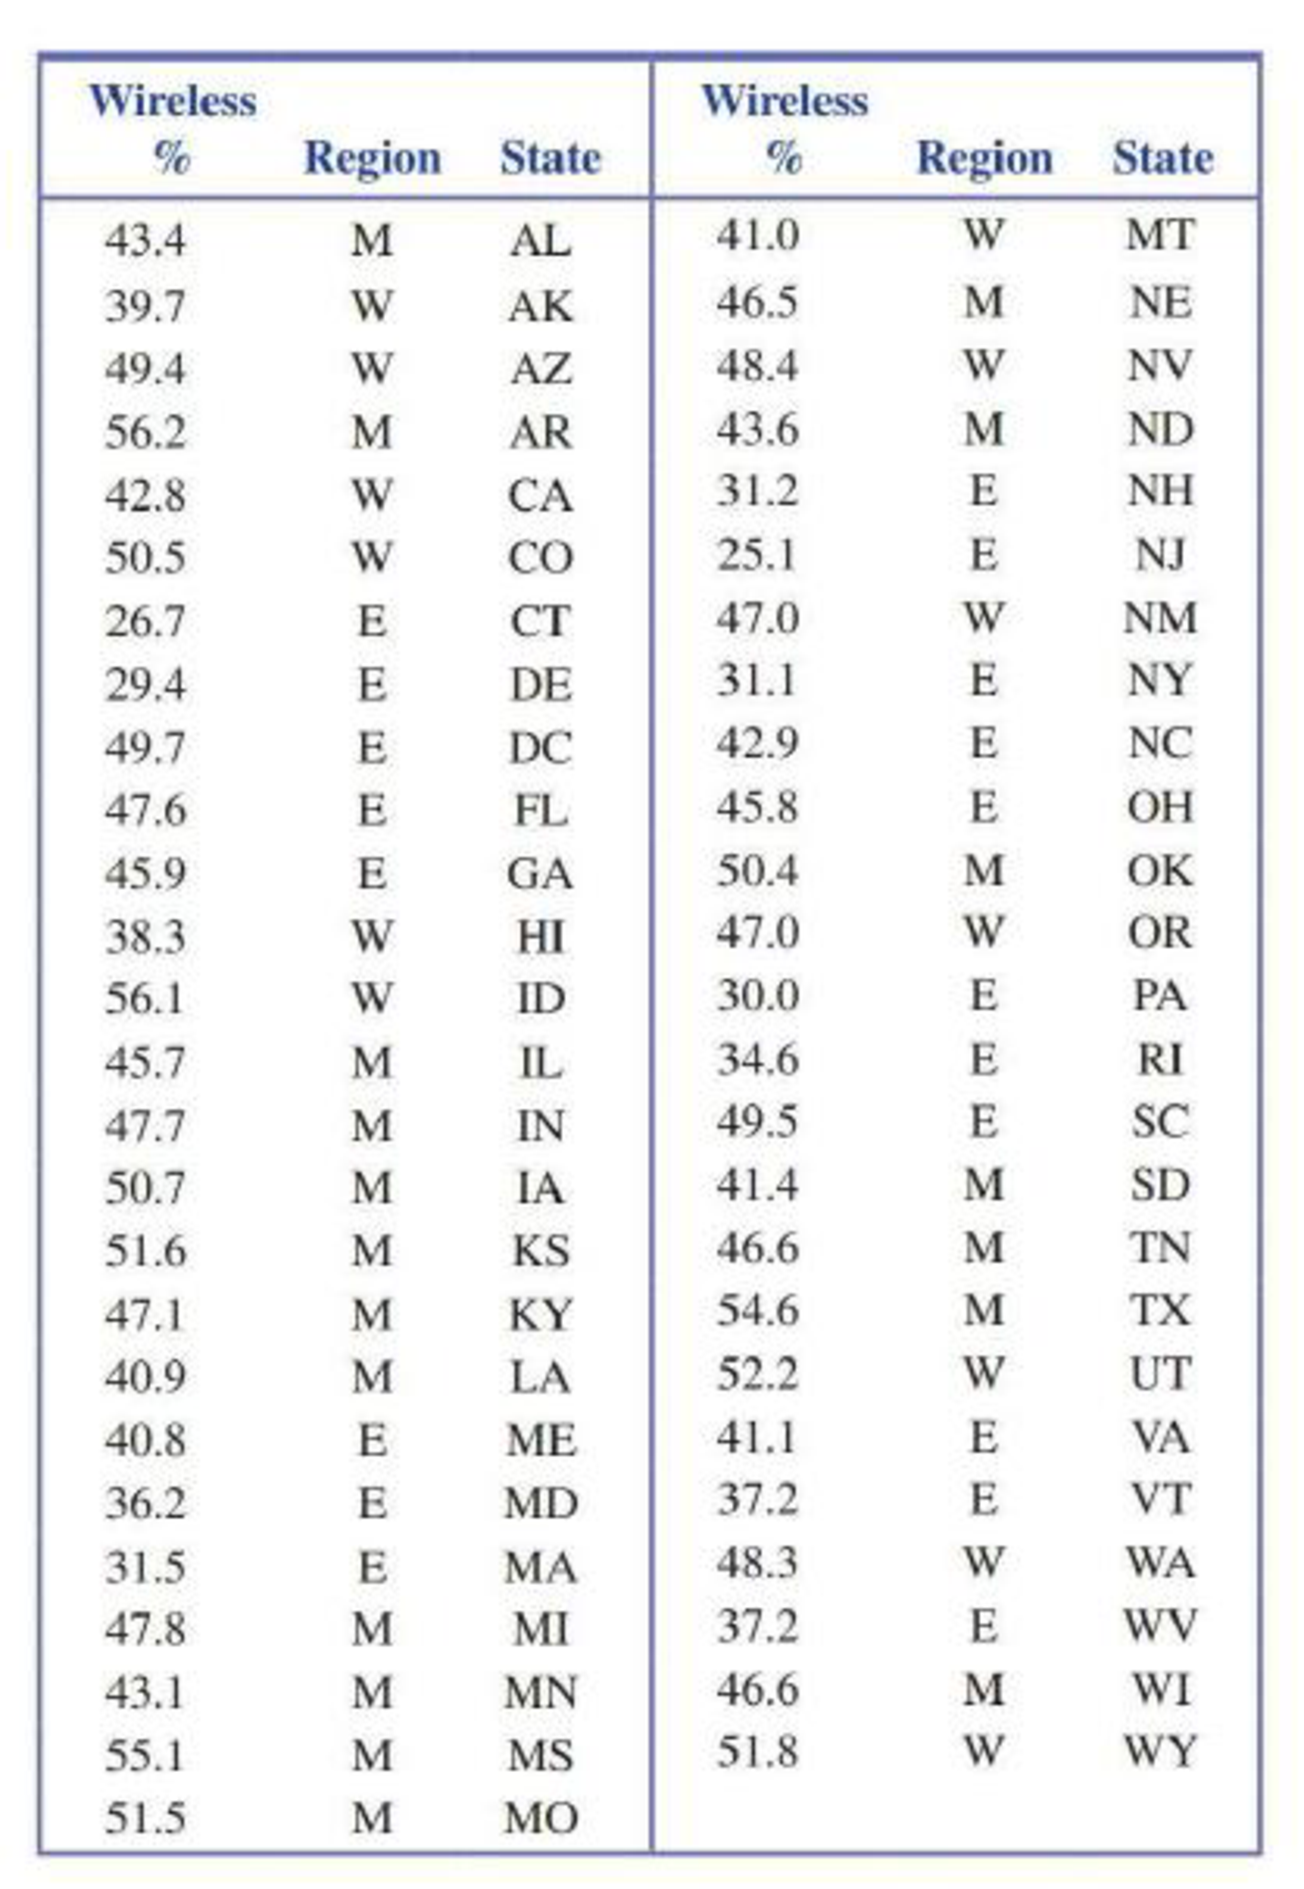
- a. Construct a comparative boxplot that makes it possible to compare wireless percent for the three geographical regions.
- b. Does the graphical display in Part (a) reveal any striking differences, or are the distributions similar for the three regions?
Expert Solution & Answer
Want to see the full answer?
Check out a sample textbook solution
Students have asked these similar questions
Sales personnel for Skillings Distributors submit weekly reports listing the customer contacts made during the week. A sample of 65 weekly reports showed a sample mean of 19.5 customer contacts per week. The sample standard deviation was 5.2. Provide 90% and 95% confidence intervals for the population mean number of weekly customer contacts for the sales personnel.
90% Confidence interval, to 2 decimals:
( , )
95% Confidence interval, to 2 decimals:
A simple random sample of 40 items resulted in a sample mean of 25. The population standard deviation is 5.
a. What is the standard error of the mean (to 2 decimals)?
b. At 95% confidence, what is the margin of error (to 2 decimals)?
mean trough level of the population to be 3.7 micrograms/mL. The researcher conducts a study among 93 newly diagnosed arthritis patients and finds the mean trough to be 4.1 micrograms/mL with a standard deviation of 2.4 micrograms/mL. The researcher wants to test at the 5% level of significance if the trough is different than previously reported or not. Z statistics will be used.
Complete Step 5 of hypothesis testing: Conclusion. State whether or not you would reject the null hypothesis and why. Also interpret what this means (i.e. is the mean trough different from 3.7 or no
Chapter 4 Solutions
Introduction To Statistics And Data Analysis
Ch. 4.1 - The following are the prices (in dollars) of the...Ch. 4.1 - The article Caffeine Content of Drinks...Ch. 4.1 - Consumer Reports Health...Ch. 4.1 - Consumer Reports Health...Ch. 4.1 - The article The Wedding Industrys Pricey Little...Ch. 4.1 - The state of California defines family income...Ch. 4.1 - The report State of the News Media 2015 (Pew...Ch. 4.1 - Each student in a sample of 20 seniors at a...Ch. 4.1 - The U.S. Department of Transportation reported the...Ch. 4.1 - The ministry of Health and Long-Term Care in...
Ch. 4.1 - Houses in California are expensive, especially on...Ch. 4.1 - Consider the following statement: More than 65% of...Ch. 4.1 - A sample consisting of four pieces of luggage was...Ch. 4.1 - Suppose that 10 patients with meningitis received...Ch. 4.1 - A study of the lifetime (in hours) for a certain...Ch. 4.1 - An instructor has graded 19 exam papers submitted...Ch. 4.2 - The following data are costs (in cents) per ounce...Ch. 4.2 - Cost per serving (in cents) for six high-fiber...Ch. 4.2 - Combining the cost-per-serving data for high-fiber...Ch. 4.2 - Prob. 20ECh. 4.2 - The accompanying data are consistent with summary...Ch. 4.2 - The paper referenced in the previous exercise also...Ch. 4.2 - The price (in dollars) of the eight smart phones...Ch. 4.2 - In addition to the prices of the highly rated...Ch. 4.2 - In an experiment to assess the effect of listening...Ch. 4.2 - The paper referenced in the previous exercise also...Ch. 4.2 - The accompanying data on number of minutes used...Ch. 4.2 - Give two sets of five numbers that have the same...Ch. 4.2 - Morningstar is an investment research from that...Ch. 4.2 - The U.S. Department of Transportation reported the...Ch. 4.2 - The Ministry of Health and Long-Term Care in...Ch. 4.2 - In 1997, a woman sued a computer keyboard...Ch. 4.2 - The standard deviation alone does not measure...Ch. 4.3 - Based on a large national sample of working...Ch. 4.3 - The report Most Licensed Drivers Age 85+: States...Ch. 4.3 - Data on the gasoline tax per gallon (in cents) in...Ch. 4.3 - The U.S. Department of Health and Human Services...Ch. 4.3 - Fiber content (in grns per serving) for 18 high...Ch. 4.3 - In addition to the fiber contents given in the...Ch. 4.3 - Use the fiber content and sugar content data given...Ch. 4.3 - The article The Bestand WorstPlaces to be a...Ch. 4.4 - The average playing time of music albums in a...Ch. 4.4 - In a study investigating the effect of car speed...Ch. 4.4 - The U.S. Census Bureau (2000 census) reported the...Ch. 4.4 - For the travel time distribution given in the...Ch. 4.4 - Use the information given in the previous two...Ch. 4.4 - Mobile homes are tightly constructed for energy...Ch. 4.4 - The article Impact of Berkeley Excise Tax on...Ch. 4.4 - A student took two national aptitude tests. The...Ch. 4.4 - Suppose that your younger sister is applying for...Ch. 4.4 - The report Who Borrows Most? Bachelors Degree...Ch. 4.4 - The paper Study of the Flying Ability of...Ch. 4.4 - Suppose that the manufacturer of a scale claims...Ch. 4.4 - Suppose that your statistics professor returned...Ch. 4.4 - The paper Answer Changing in Multiple Choice...Ch. 4.4 - Suppose that the average reading speed of students...Ch. 4.4 - The following data values are 2014 per capita...Ch. 4.4 - The accompanying table gives the mean and standard...Ch. 4.5 - The authors of the paper Delayed Time to...Ch. 4.5 - The paper Portable Social Groups: Willingness to...Ch. 4 - Acrylamide (a possible cancer-causing substance)...Ch. 4 - Prob. 62CRCh. 4 - Because some homes have selling prices that are...Ch. 4 - Although bats are not known for their eyesight,...Ch. 4 - For the data in the previous exercise, subtract 10...Ch. 4 - For the data of Exercise 4.64, multiply each data...Ch. 4 - The Bloomberg web site included the data in the...Ch. 4 - Refer to the data given in the previous exercise....Ch. 4 - Age at diagnosis for each of 20 patients under...Ch. 4 - Suppose that the distribution of scores on an exam...
Additional Math Textbook Solutions
Find more solutions based on key concepts
For Exercises 13–18, write the negation of the statement.
13. The cell phone is out of juice.
Math in Our World
1. How is a sample related to a population?
Elementary Statistics: Picturing the World (7th Edition)
Check Your Understanding
Reading Check Complete each sentence using > or < for □.
RC1. 3 dm □ 3 dam
Basic College Mathematics
Length of a Guy Wire A communications tower is located at the top of a steep hill, as shown. The angle of incli...
Precalculus: Mathematics for Calculus (Standalone Book)
Empirical versus Theoretical A Monopoly player claims that the probability of getting a 4 when rolling a six-si...
Introductory Statistics
Evaluate the integrals in Exercises 1–46.
1.
University Calculus: Early Transcendentals (4th Edition)
Knowledge Booster


Learn more about
Need a deep-dive on the concept behind this application? Look no further. Learn more about this topic, statistics and related others by exploring similar questions and additional content below.Similar questions
- 30% of all college students major in STEM (Science, Technology, Engineering, and Math). If 48 college students are randomly selected, find the probability thata. Exactly 12 of them major in STEM. b. At most 17 of them major in STEM. c. At least 12 of them major in STEM. d. Between 9 and 13 (including 9 and 13) of them major in STEM.arrow_forward7% of all Americans live in poverty. If 40 Americans are randomly selected, find the probability thata. Exactly 4 of them live in poverty. b. At most 1 of them live in poverty. c. At least 1 of them live in poverty. d. Between 2 and 9 (including 2 and 9) of them live in poverty.arrow_forward48% of all violent felons in the prison system are repeat offenders. If 40 violent felons are randomly selected, find the probability that a. Exactly 18 of them are repeat offenders. b. At most 18 of them are repeat offenders. c. At least 18 of them are repeat offenders. d. Between 17 and 21 (including 17 and 21) of them are repeat offenders.arrow_forward
- Consider an MA(6) model with θ1 = 0.5, θ2 = −25, θ3 = 0.125, θ4 = −0.0625, θ5 = 0.03125, and θ6 = −0.015625. Find a much simpler model that has nearly the same ψ-weights.arrow_forwardLet {Yt} be an AR(2) process of the special form Yt = φ2Yt − 2 + et. Use first principles to find the range of values of φ2 for which the process is stationary.arrow_forwardDescribe the important characteristics of the autocorrelation function for the following models: (a) MA(1), (b) MA(2), (c) AR(1), (d) AR(2), and (e) ARMA(1,1).arrow_forward
- « CENGAGE MINDTAP Quiz: Chapter 38 Assignment: Quiz: Chapter 38 ips Questions ra1kw08h_ch38.15m 13. 14. 15. O Which sentence has modifiers in the correct place? O a. When called, she for a medical emergency responds quickly. b. Without giving away too much of the plot, Helena described the heroine's actions in the film. O c. Nearly the snakebite victim died before the proper antitoxin was injected. . O O 16 16. O 17. 18. O 19. O 20 20. 21 21. 22. 22 DS 23. 23 24. 25. O O Oarrow_forwardQuestions ra1kw08h_ch36.14m 12. 13. 14. 15. 16. Ӧ 17. 18. 19. OS 20. Two separate sentences need Oa. two separate subjects. Ob. two dependent clauses. c. one shared subject.arrow_forwardCustomers experiencing technical difficulty with their Internet cable service may call an 800 number for technical support. It takes the technician between 30 seconds and 11 minutes to resolve the problem. The distribution of this support time follows the uniform distribution. Required: a. What are the values for a and b in minutes? Note: Do not round your intermediate calculations. Round your answers to 1 decimal place. b-1. What is the mean time to resolve the problem? b-2. What is the standard deviation of the time? c. What percent of the problems take more than 5 minutes to resolve? d. Suppose we wish to find the middle 50% of the problem-solving times. What are the end points of these two times?arrow_forward
- Exercise 6-6 (Algo) (LO6-3) The director of admissions at Kinzua University in Nova Scotia estimated the distribution of student admissions for the fall semester on the basis of past experience. Admissions Probability 1,100 0.5 1,400 0.4 1,300 0.1 Click here for the Excel Data File Required: What is the expected number of admissions for the fall semester? Compute the variance and the standard deviation of the number of admissions. Note: Round your standard deviation to 2 decimal places.arrow_forward1. Find the mean of the x-values (x-bar) and the mean of the y-values (y-bar) and write/label each here: 2. Label the second row in the table using proper notation; then, complete the table. In the fifth and sixth columns, show the 'products' of what you're multiplying, as well as the answers. X y x minus x-bar y minus y-bar (x minus x-bar)(y minus y-bar) (x minus x-bar)^2 xy 16 20 34 4-2 5 2 3. Write the sums that represents Sxx and Sxy in the table, at the bottom of their respective columns. 4. Find the slope of the Regression line: bi = (simplify your answer) 5. Find the y-intercept of the Regression line, and then write the equation of the Regression line. Show your work. Then, BOX your final answer. Express your line as "y-hat equals...arrow_forwardApply STATA commands & submit the output for each question only when indicated below i. Generate the log of birthweight and family income of children. Name these new variables Ibwght & Ifaminc. Include the output of this code. ii. Apply the command sum with the detail option to the variable faminc. Note: you should find the 25th percentile value, the 50th percentile and the 75th percentile value of faminc from the output - you will need it to answer the next question Include the output of this code. iii. iv. Use the output from part ii of this question to Generate a variable called "high_faminc" that takes a value 1 if faminc is less than or equal to the 25th percentile, it takes the value 2 if faminc is greater than 25th percentile but less than or equal to the 50th percentile, it takes the value 3 if faminc is greater than 50th percentile but less than or equal to the 75th percentile, it takes the value 4 if faminc is greater than the 75th percentile. Include the outcome of this code…arrow_forward
arrow_back_ios
SEE MORE QUESTIONS
arrow_forward_ios
Recommended textbooks for you
 Glencoe Algebra 1, Student Edition, 9780079039897...AlgebraISBN:9780079039897Author:CarterPublisher:McGraw Hill
 Big Ideas Math A Bridge To Success Algebra 1: Stu...AlgebraISBN:9781680331141Author:HOUGHTON MIFFLIN HARCOURTPublisher:Houghton Mifflin Harcourt
 Holt Mcdougal Larson Pre-algebra: Student Edition...AlgebraISBN:9780547587776Author:HOLT MCDOUGALPublisher:HOLT MCDOUGAL
Glencoe Algebra 1, Student Edition, 9780079039897...
Algebra
ISBN:9780079039897
Author:Carter
Publisher:McGraw Hill
Big Ideas Math A Bridge To Success Algebra 1: Stu...
Algebra
ISBN:9781680331141
Author:HOUGHTON MIFFLIN HARCOURT
Publisher:Houghton Mifflin Harcourt
Holt Mcdougal Larson Pre-algebra: Student Edition...
Algebra
ISBN:9780547587776
Author:HOLT MCDOUGAL
Publisher:HOLT MCDOUGAL
Hypothesis Testing - Solving Problems With Proportions; Author: The Organic Chemistry Tutor;https://www.youtube.com/watch?v=76VruarGn2Q;License: Standard YouTube License, CC-BY
Hypothesis Testing and Confidence Intervals (FRM Part 1 – Book 2 – Chapter 5); Author: Analystprep;https://www.youtube.com/watch?v=vth3yZIUlGQ;License: Standard YouTube License, CC-BY