
Introduction To Statistics And Data Analysis
6th Edition
ISBN: 9781337793612
Author: PECK, Roxy.
Publisher: Cengage Learning,
expand_more
expand_more
format_list_bulleted
Videos
Textbook Question
Chapter 4.3, Problem 35E
The report “Most Licensed Drivers Age 85+: States” (bloom berg.com/graphics/best-and-worst/#most-licensed-drivers-age-85-plus-states, retrieved April 20, 2017) gives the percentage of drivers in each state and the District of Columbia in 2011 who were over 85 years of age.
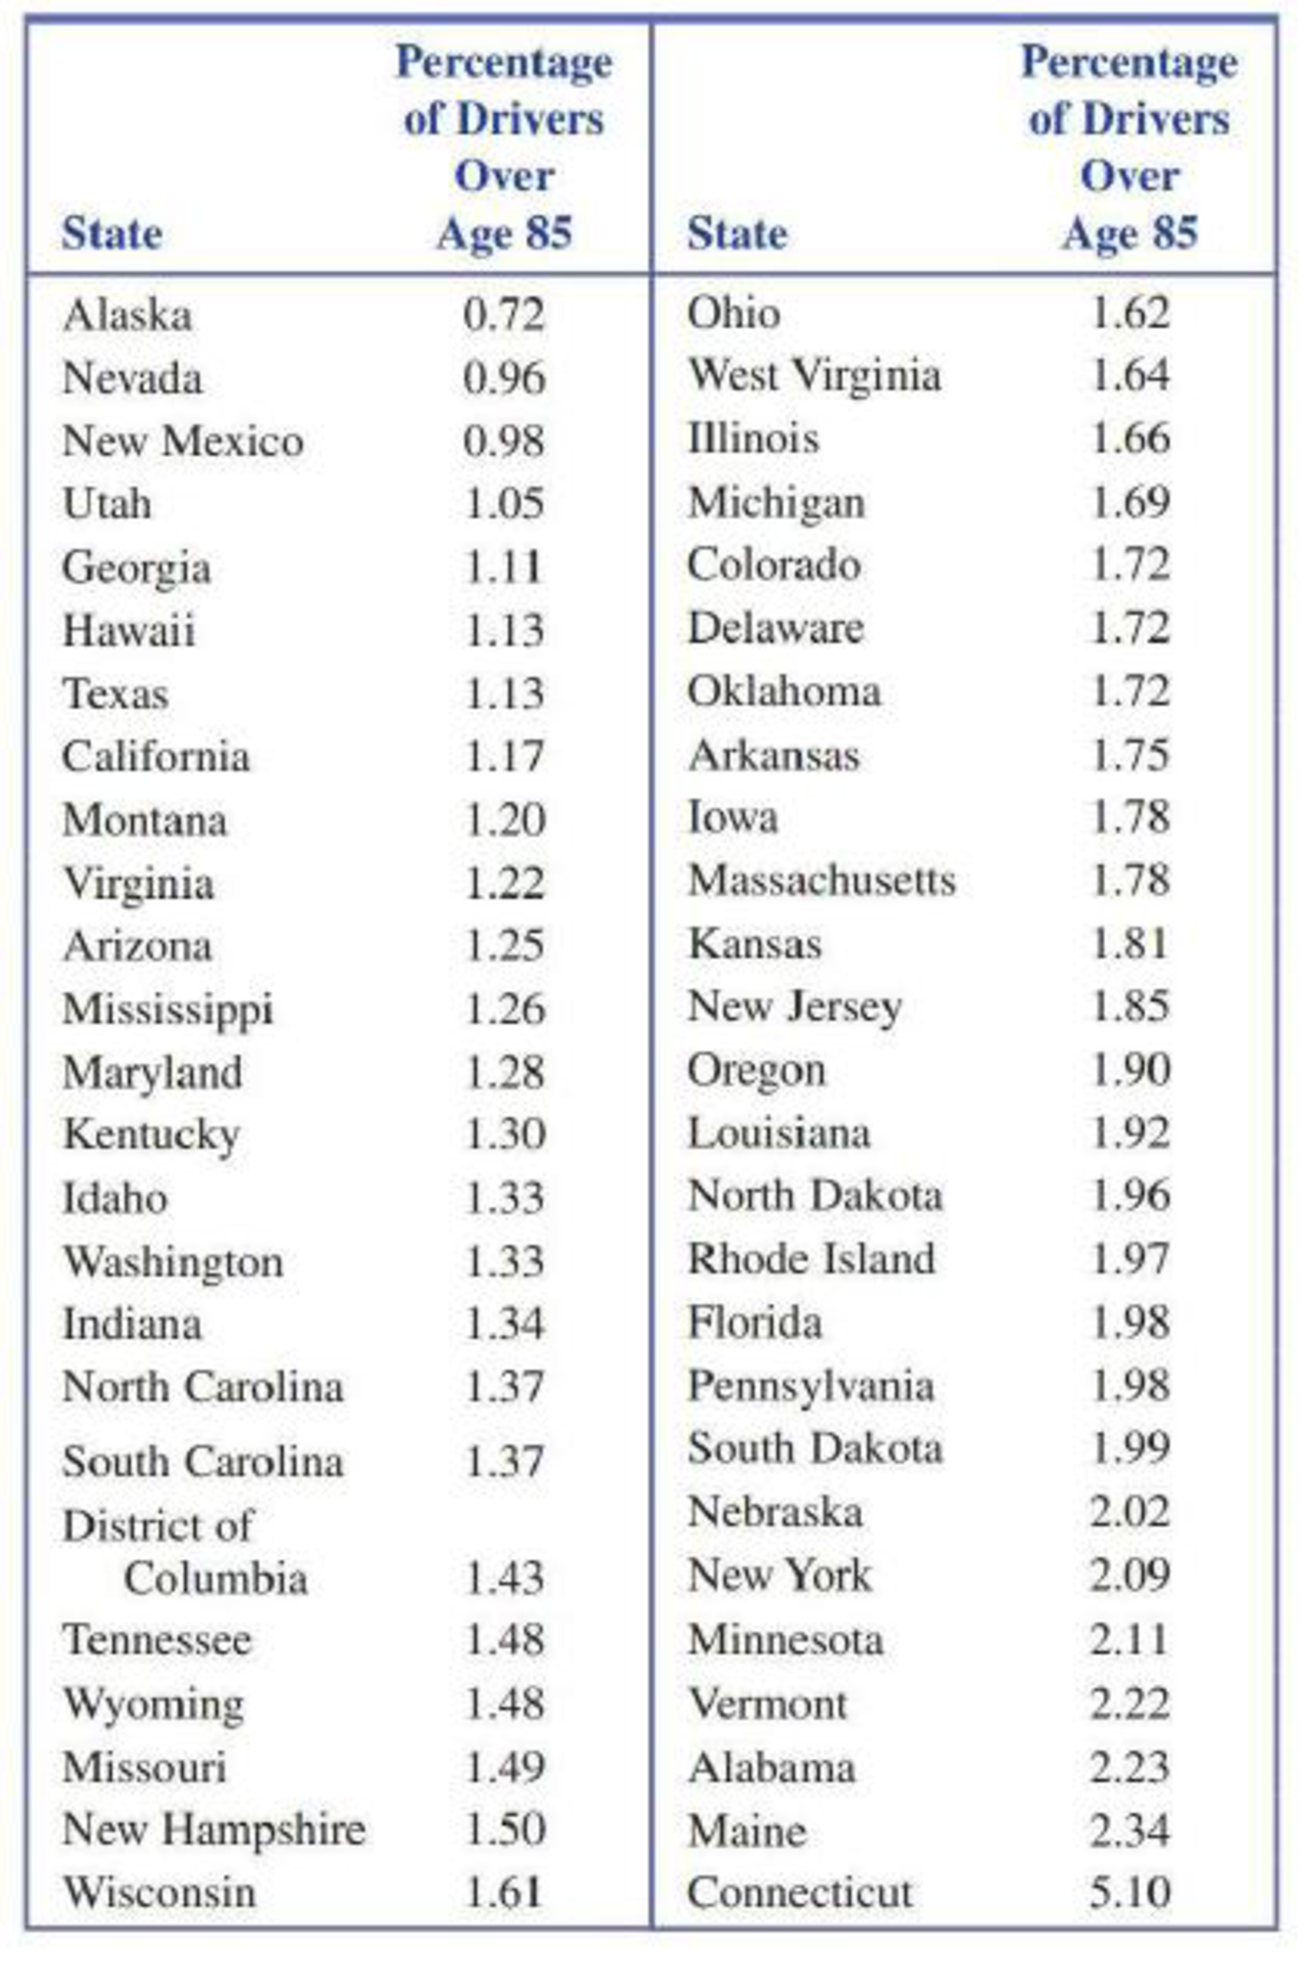
- a. Find the values of the
median , the lowerquartile , and the upper quartile. - b. The largest value in the data set is 5 .10% (Connecticut). Is this state an outlier? (Hint: See Example 4.11.)
- c. Construct a modified boxplot for this data set and comment on the interesting features of the plot. How would you describe the shape of the distribution if you don’t consider the outlier?
Expert Solution & Answer

Trending nowThis is a popular solution!

Students have asked these similar questions
21.
find the mean.
and
variance of the
following:
Ⓒ x(t) = Ut +V, and V indepriv. s.t
U.VN NL0, 63).
X(t) = t² + Ut +V, U and V incepires have N (0,8)
Ut
①xt = e UNN (0162)
~ X+ = UCOSTE, UNNL0, 62)
SU, Oct
⑤Xt=
7
where U. Vindp.rus
+> ½
have NL, 62).
⑥Xn = ΣY, 41, 42, 43, ... Yn vandom sample
K=1
Text
with mean zen and variance 6
A psychology researcher conducted a Chi-Square Test of Independence to examine whether there is a relationship between college students’ year in school (Freshman, Sophomore, Junior, Senior) and their preferred coping strategy for academic stress (Problem-Focused, Emotion-Focused, Avoidance). The test yielded the following result:
image.png
Interpret the results of this analysis. In your response, clearly explain:
Whether the result is statistically significant and why.
What this means about the relationship between year in school and coping strategy.
What the researcher should conclude based on these findings.
A school counselor is conducting a research study to examine whether there is a relationship between the number of times teenagers report vaping per week and their academic performance, measured by GPA. The counselor collects data from a sample of high school students. Write the null and alternative hypotheses for this study. Clearly state your hypotheses in terms of the correlation between vaping frequency and academic performance.
EditViewInsertFormatToolsTable
12pt
Paragraph
Chapter 4 Solutions
Introduction To Statistics And Data Analysis
Ch. 4.1 - The following are the prices (in dollars) of the...Ch. 4.1 - The article Caffeine Content of Drinks...Ch. 4.1 - Consumer Reports Health...Ch. 4.1 - Consumer Reports Health...Ch. 4.1 - The article The Wedding Industrys Pricey Little...Ch. 4.1 - The state of California defines family income...Ch. 4.1 - The report State of the News Media 2015 (Pew...Ch. 4.1 - Each student in a sample of 20 seniors at a...Ch. 4.1 - The U.S. Department of Transportation reported the...Ch. 4.1 - The ministry of Health and Long-Term Care in...
Ch. 4.1 - Houses in California are expensive, especially on...Ch. 4.1 - Consider the following statement: More than 65% of...Ch. 4.1 - A sample consisting of four pieces of luggage was...Ch. 4.1 - Suppose that 10 patients with meningitis received...Ch. 4.1 - A study of the lifetime (in hours) for a certain...Ch. 4.1 - An instructor has graded 19 exam papers submitted...Ch. 4.2 - The following data are costs (in cents) per ounce...Ch. 4.2 - Cost per serving (in cents) for six high-fiber...Ch. 4.2 - Combining the cost-per-serving data for high-fiber...Ch. 4.2 - Prob. 20ECh. 4.2 - The accompanying data are consistent with summary...Ch. 4.2 - The paper referenced in the previous exercise also...Ch. 4.2 - The price (in dollars) of the eight smart phones...Ch. 4.2 - In addition to the prices of the highly rated...Ch. 4.2 - In an experiment to assess the effect of listening...Ch. 4.2 - The paper referenced in the previous exercise also...Ch. 4.2 - The accompanying data on number of minutes used...Ch. 4.2 - Give two sets of five numbers that have the same...Ch. 4.2 - Morningstar is an investment research from that...Ch. 4.2 - The U.S. Department of Transportation reported the...Ch. 4.2 - The Ministry of Health and Long-Term Care in...Ch. 4.2 - In 1997, a woman sued a computer keyboard...Ch. 4.2 - The standard deviation alone does not measure...Ch. 4.3 - Based on a large national sample of working...Ch. 4.3 - The report Most Licensed Drivers Age 85+: States...Ch. 4.3 - Data on the gasoline tax per gallon (in cents) in...Ch. 4.3 - The U.S. Department of Health and Human Services...Ch. 4.3 - Fiber content (in grns per serving) for 18 high...Ch. 4.3 - In addition to the fiber contents given in the...Ch. 4.3 - Use the fiber content and sugar content data given...Ch. 4.3 - The article The Bestand WorstPlaces to be a...Ch. 4.4 - The average playing time of music albums in a...Ch. 4.4 - In a study investigating the effect of car speed...Ch. 4.4 - The U.S. Census Bureau (2000 census) reported the...Ch. 4.4 - For the travel time distribution given in the...Ch. 4.4 - Use the information given in the previous two...Ch. 4.4 - Mobile homes are tightly constructed for energy...Ch. 4.4 - The article Impact of Berkeley Excise Tax on...Ch. 4.4 - A student took two national aptitude tests. The...Ch. 4.4 - Suppose that your younger sister is applying for...Ch. 4.4 - The report Who Borrows Most? Bachelors Degree...Ch. 4.4 - The paper Study of the Flying Ability of...Ch. 4.4 - Suppose that the manufacturer of a scale claims...Ch. 4.4 - Suppose that your statistics professor returned...Ch. 4.4 - The paper Answer Changing in Multiple Choice...Ch. 4.4 - Suppose that the average reading speed of students...Ch. 4.4 - The following data values are 2014 per capita...Ch. 4.4 - The accompanying table gives the mean and standard...Ch. 4.5 - The authors of the paper Delayed Time to...Ch. 4.5 - The paper Portable Social Groups: Willingness to...Ch. 4 - Acrylamide (a possible cancer-causing substance)...Ch. 4 - Prob. 62CRCh. 4 - Because some homes have selling prices that are...Ch. 4 - Although bats are not known for their eyesight,...Ch. 4 - For the data in the previous exercise, subtract 10...Ch. 4 - For the data of Exercise 4.64, multiply each data...Ch. 4 - The Bloomberg web site included the data in the...Ch. 4 - Refer to the data given in the previous exercise....Ch. 4 - Age at diagnosis for each of 20 patients under...Ch. 4 - Suppose that the distribution of scores on an exam...
Additional Math Textbook Solutions
Find more solutions based on key concepts
Reading, Writing, and Rounding Whole Numbers Write in words. 357
Mathematics for the Trades: A Guided Approach (11th Edition) (What's New in Trade Math)
1. How is a sample related to a population?
Elementary Statistics: Picturing the World (7th Edition)
Check Your Understanding
Reading Check Complete each sentence using > or < for □.
RC1. 3 dm □ 3 dam
Basic College Mathematics
Use the ideas in drawings a and b to find the solution to Gausss Problem for the sum 1+2+3+...+n. Explain your ...
A Problem Solving Approach To Mathematics For Elementary School Teachers (13th Edition)
Empirical versus Theoretical A Monopoly player claims that the probability of getting a 4 when rolling a six-si...
Introductory Statistics
(a) Make a stem-and-leaf plot for these 24 observations on the number of customers who used a down-town CitiBan...
APPLIED STAT.IN BUS.+ECONOMICS
Knowledge Booster


Learn more about
Need a deep-dive on the concept behind this application? Look no further. Learn more about this topic, statistics and related others by exploring similar questions and additional content below.Similar questions
- A smallish urn contains 25 small plastic bunnies – 7 of which are pink and 18 of which are white. 10 bunnies are drawn from the urn at random with replacement, and X is the number of pink bunnies that are drawn. (a) P(X = 5) ≈ (b) P(X<6) ≈ The Whoville small urn contains 100 marbles – 60 blue and 40 orange. The Grinch sneaks in one night and grabs a simple random sample (without replacement) of 15 marbles. (a) The probability that the Grinch gets exactly 6 blue marbles is [ Select ] ["≈ 0.054", "≈ 0.043", "≈ 0.061"] . (b) The probability that the Grinch gets at least 7 blue marbles is [ Select ] ["≈ 0.922", "≈ 0.905", "≈ 0.893"] . (c) The probability that the Grinch gets between 8 and 12 blue marbles (inclusive) is [ Select ] ["≈ 0.801", "≈ 0.760", "≈ 0.786"] . The Whoville small urn contains 100 marbles – 60 blue and 40 orange. The Grinch sneaks in one night and grabs a simple random sample (without replacement) of 15 marbles. (a)…arrow_forwardSuppose an experiment was conducted to compare the mileage(km) per litre obtained by competing brands of petrol I,II,III. Three new Mazda, three new Toyota and three new Nissan cars were available for experimentation. During the experiment the cars would operate under same conditions in order to eliminate the effect of external variables on the distance travelled per litre on the assigned brand of petrol. The data is given as below: Brands of Petrol Mazda Toyota Nissan I 10.6 12.0 11.0 II 9.0 15.0 12.0 III 12.0 17.4 13.0 (a) Test at the 5% level of significance whether there are signi cant differences among the brands of fuels and also among the cars. [10] (b) Compute the standard error for comparing any two fuel brands means. Hence compare, at the 5% level of significance, each of fuel brands II, and III with the standard fuel brand I. [10] �arrow_forwardBusiness discussarrow_forward
- What would you say about a set of quantitative bivariate data whose linear correlation is -1? What would a scatter diagram of the data look like? (5 points)arrow_forwardBusiness discussarrow_forwardAnalyze the residuals of a linear regression model and select the best response. yes, the residual plot does not show a curve no, the residual plot shows a curve yes, the residual plot shows a curve no, the residual plot does not show a curve I answered, "No, the residual plot shows a curve." (and this was incorrect). I am not sure why I keep getting these wrong when the answer seems obvious. Please help me understand what the yes and no references in the answer.arrow_forward
- a. Find the value of A.b. Find pX(x) and py(y).c. Find pX|y(x|y) and py|X(y|x)d. Are x and y independent? Why or why not?arrow_forwardAnalyze the residuals of a linear regression model and select the best response.Criteria is simple evaluation of possible indications of an exponential model vs. linear model) no, the residual plot does not show a curve yes, the residual plot does not show a curve yes, the residual plot shows a curve no, the residual plot shows a curve I selected: yes, the residual plot shows a curve and it is INCORRECT. Can u help me understand why?arrow_forwardYou have been hired as an intern to run analyses on the data and report the results back to Sarah; the five questions that Sarah needs you to address are given below. please do it step by step on excel Does there appear to be a positive or negative relationship between price and screen size? Use a scatter plot to examine the relationship. Determine and interpret the correlation coefficient between the two variables. In your interpretation, discuss the direction of the relationship (positive, negative, or zero relationship). Also discuss the strength of the relationship. Estimate the relationship between screen size and price using a simple linear regression model and interpret the estimated coefficients. (In your interpretation, tell the dollar amount by which price will change for each unit of increase in screen size). Include the manufacturer dummy variable (Samsung=1, 0 otherwise) and estimate the relationship between screen size, price and manufacturer dummy as a multiple…arrow_forward
- Here is data with as the response variable. x y54.4 19.124.9 99.334.5 9.476.6 0.359.4 4.554.4 0.139.2 56.354 15.773.8 9-156.1 319.2Make a scatter plot of this data. Which point is an outlier? Enter as an ordered pair, e.g., (x,y). (x,y)= Find the regression equation for the data set without the outlier. Enter the equation of the form mx+b rounded to three decimal places. y_wo= Find the regression equation for the data set with the outlier. Enter the equation of the form mx+b rounded to three decimal places. y_w=arrow_forwardYou have been hired as an intern to run analyses on the data and report the results back to Sarah; the five questions that Sarah needs you to address are given below. please do it step by step Does there appear to be a positive or negative relationship between price and screen size? Use a scatter plot to examine the relationship. Determine and interpret the correlation coefficient between the two variables. In your interpretation, discuss the direction of the relationship (positive, negative, or zero relationship). Also discuss the strength of the relationship. Estimate the relationship between screen size and price using a simple linear regression model and interpret the estimated coefficients. (In your interpretation, tell the dollar amount by which price will change for each unit of increase in screen size). Include the manufacturer dummy variable (Samsung=1, 0 otherwise) and estimate the relationship between screen size, price and manufacturer dummy as a multiple linear…arrow_forwardExercises: Find all the whole number solutions of the congruence equation. 1. 3x 8 mod 11 2. 2x+3= 8 mod 12 3. 3x+12= 7 mod 10 4. 4x+6= 5 mod 8 5. 5x+3= 8 mod 12arrow_forward
arrow_back_ios
SEE MORE QUESTIONS
arrow_forward_ios
Recommended textbooks for you
 Glencoe Algebra 1, Student Edition, 9780079039897...AlgebraISBN:9780079039897Author:CarterPublisher:McGraw Hill
 Big Ideas Math A Bridge To Success Algebra 1: Stu...AlgebraISBN:9781680331141Author:HOUGHTON MIFFLIN HARCOURTPublisher:Houghton Mifflin Harcourt
 Holt Mcdougal Larson Pre-algebra: Student Edition...AlgebraISBN:9780547587776Author:HOLT MCDOUGALPublisher:HOLT MCDOUGAL
Glencoe Algebra 1, Student Edition, 9780079039897...
Algebra
ISBN:9780079039897
Author:Carter
Publisher:McGraw Hill
Big Ideas Math A Bridge To Success Algebra 1: Stu...
Algebra
ISBN:9781680331141
Author:HOUGHTON MIFFLIN HARCOURT
Publisher:Houghton Mifflin Harcourt
Holt Mcdougal Larson Pre-algebra: Student Edition...
Algebra
ISBN:9780547587776
Author:HOLT MCDOUGAL
Publisher:HOLT MCDOUGAL
Hypothesis Testing using Confidence Interval Approach; Author: BUM2413 Applied Statistics UMP;https://www.youtube.com/watch?v=Hq1l3e9pLyY;License: Standard YouTube License, CC-BY
Hypothesis Testing - Difference of Two Means - Student's -Distribution & Normal Distribution; Author: The Organic Chemistry Tutor;https://www.youtube.com/watch?v=UcZwyzwWU7o;License: Standard Youtube License