
Concept explainers
Videos
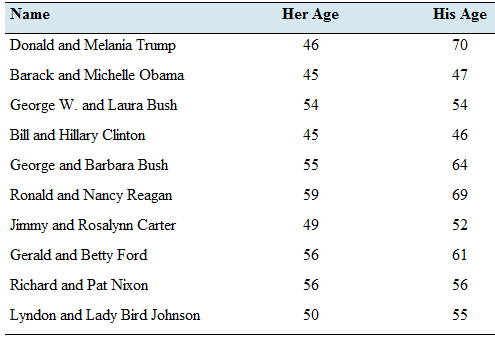
Presidents and first ladies: The presents the ages of the last 10 U.S. presidents and their wives on the first day of their presidencies.
- Compute the least-squares regression line for predicting the president’s age from the first lady’s age.
- Compute the coefficient of determination-
- Construct a
scatterplot of the presidents' ages (y) versus the first ladies' ages (x). - Which point is an outlier?
- Remove die outlier and compute the least-squares regression line for predicting the president’s age from the first lady: s age.
- Is the outlier influential? Explain.
- Compute the coefficient of determination for the data set with the outlier removed. Is due proportion of variation explained by due least-squares regression he greater, less. or about the same without due outlier? Explain.
a.
To Calculate: The least-squares regression line for predicting the president’s age from lady’s age.
Answer to Problem 24E
The least-squares regression line is,
Explanation of Solution
Given: The following table presents the age of the president’s and their wives on the first day of their presidencies.
| Name | Her Age | His Age |
| Donald and Melania Trump | 46 | 70 |
| Barak and Mechelle Obama | 45 | 47 |
| George W. and Laura Bush | 54 | 54 |
| Bill and Hillary Clinton | 45 | 46 |
| George and Babara Bush | 55 | 64 |
| Ronald and Nancy Reagan | 59 | 69 |
| Jimmy and Rosalyn Carter | 49 | 52 |
| Gerald and Betty Ford | 56 | 61 |
| Richard and Pat Nixon | 56 | 56 |
| Lyndon and Lady Bird Johnson | 50 | 55 |
Calculation:
Here,
From below formula we can find least regression line.
where
We can find these constants from below formulas.
Where,
| Descriptive Statistics | |||
| N | Mean | Std. Deviation | |
| His age | 10 | 57.40 | 8.409 |
| Her age | 10 | 51.50 | 5.148 |
| Valid N (listwise) | 10 | ||
To find constants,
And,
By substituting above formula,
Conclusion:
The least-squares regression line for predicting the president’s age from lady’s age is,
b.
To find: The correlation coefficient of the two variables.
Answer to Problem 24E
The correlation coefficient is found to be,
Explanation of Solution
Calculation:
The correlation coefficient
Where
The means and the standard deviations of the both variables can be obtained by using the Excel.
| Descriptive Statistics | |||
| N | Mean | Std. Deviation | |
| His age | 10 | 57.40 | 8.409 |
| Her age | 10 | 51.50 | 5.148 |
| Valid N (listwise) | 10 | ||
Then,
Then, a table should be constructed to calculate
The correlation coefficient can be calculated as,
Conclusion:
The correlation coefficient between the interest rates for two mortgage plans is found tobe,
c.
To graph: The scatter plot of the given two quantitative variables.
Explanation of Solution
Graph:
Let
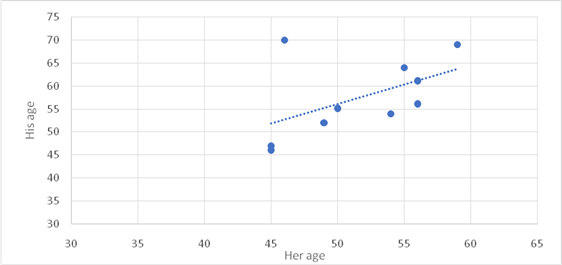
Interpretation:
Out of all these
d.
To Identify: The outliers within the given data.
Answer to Problem 24E
There is one outlier which is age
Explanation of Solution
Explain:
Here, Excel is used to calculate below statistics.
The interquartile range is equal to
To calculate upper bound,
To calculate lower bound,
An outlier is a data point that lies outside the upper bound and lower bound.
Out of all
e.
To find: The least-squares regression line for predicting the president’s age from lady’s age with removing outlier.
Answer to Problem 24E
The least-squares regression is,
Explanation of Solution
Calculation:
Here,
From below formula we can find least regression line.
where
We can find constants from below formulas.
Where,
When the outlier is removed, the number of ordered pairs is
| Descriptive Statistics | |||
| N | Mean | Std. Deviation | |
| His age | 9 | 56.00 | 7.583 |
| Her age | 9 | 52.11 | 5.061 |
| Valid N (listwise) | 9 | ||
To find constants,
And,
By substituting into the above formula,
Conclusion:
The least-squares regression line for predicting the president’s age from lady’s age is,
f.
To Check: The influence of outlier.
Answer to Problem 24E
Yes. It is influenced.
Explanation of Solution
Explain:
| Descriptive Statistics | |||
| N | Mean | Std. Deviation | |
| His age | 10 | 57.40 | 8.409 |
| Her age | 10 | 51.50 | 5.148 |
| Valid N (listwise) | 10 | ||
| Descriptive Statistics | |||
| N | Mean | Std. Deviation | |
| His age | 9 | 56.00 | 7.583 |
| Her age | 9 | 52.11 | 5.061 |
| Valid N (listwise) | 9 | ||
To calculate above statistics, Excel is used. Here we can see statistics with outlier and without outlier. Second table shows statistics without outlier. Total number of observations, mean and standard deviation of dependent and independent variables are changed. So, it influences to least squares regression line for predicting the president’s age from lady’s age.
g.
To find: The correlation coefficient of the two variables without outlier.
Answer to Problem 24E
The correlation coefficient is found to be,
Explanation of Solution
Calculation:
The correlation coefficient
Where
The means and the standard deviations of the both variables can be obtained by using the Excel.
For the remaining
| Descriptive Statistics | |||
| N | Mean | Std. Deviation | |
| His age | 9 | 56.00 | 7.583 |
| Her age | 9 | 52.11 | 5.061 |
| Valid N (listwise) | 9 | ||
Then,
Then, a table should be constructed to calculate
The correlation coefficient can be calculated as,
Conclusion:
The correlation coefficient between the interest rates for two mortgage plans is found to be,
Want to see more full solutions like this?
Chapter 4 Solutions
Connect Hosted by ALEKS Access Card or Elementary Statistics


- Information for questions 4 • • Please Download "wages" from Canvas (the link to this dataset is right below the HWA1 questions - it is a Microsoft excel worksheet) and store it in your favorite folder. It contains 797 observations and 16 variables. The "state" variable gives the names of the states involved in this dataset. • You need to have excel on your computer to open this dataset. i. You should use File > Import > Excel Spreadsheet etc. as done in class 3 convert this file into a Stata dataset. Once you are done, write the final STATA code that makes the transformation of an excel file to a STATA file possible. ii. Write a code that will close the log file that has been open since Question 1 part ii.arrow_forwardThe mean, variance, skewness and kurtosis of a dataset are given as - Mean = 15, Variance = 20, SKewness = 1.5 and Kurtosis = 3.5 calculate the first four raw moments. (Note- Please include as much detailed solution/steps in the solution to understand, Thank you!)arrow_forwardWrite codes to perform the functions in each of these cases i. ii. Apply cd command to tell STATA the filepath associated with your "favorite folder" (use the same name for the favorite folder that we have been using in class) Apply log using command to tell stata that you are creating a log file to record the codes and the outcomes of these codes. Make sure your log file is called loghwa1_W25.smcl. Do not forget to include the replace option. iii. Get help for the "regress" command & include a screenshot of the outcome of this code iv. V. Open a stata file stored in STATA memory called pop2000.dta Continue from question iv. Save this file in your favorite folder (current working directory) using a different name & a replace optionarrow_forward
- Are there any unusually high or low pH levels in this sample of wells?arrow_forward0 n AM RIES s of of 10 m Frequency 40 Frequency 20 20 30 10 You make two histograms from two different data sets (see the following figures), each one containing 200 observations. Which of the histograms has a smaller spread: the first or the second? 40 30 20 10 0 20 40 60 0 20 20 40 60 60 80 80 100 80 100arrow_forwardTIP the aren't, the data are not sym 11 Suppose that the average salary at a certain company is $100,000, and the median salary is $40,000. a. What do these figures tell you about the shape of the histogram of salaries at this company? b. Which measure of center is more appro- priate here? c. Suppose that the company goes through a salary negotiation. How can people on each side use these summary statistics to their advantage? 6360 be 52 PART 1 Getting Off to a Statistically Significant Sarrow_forward
- 12 Suppose that you know that a data set is skewed left, and you know that the two measures of center are 19 and 38. Which figure is the mean and which is the median?arrow_forwardy of 45 home- televisions u find that 010020 le own one, ee, and 1 owns y histogram of 4 Suppose that you have a loaded die. You roll it several times and record the outcomes, which are shown in the following figure. Histogram for Loaded Die 444% 34.00 48% 6% 2% Frequency 20 20 15 155 10 5- ம 0 1 2 3 4 Outcome 5 6 a. Make a relative frequency histogram of these results. b. You can make a relative frequency histo- gram from a frequency histogram; can you go the other direction?arrow_forwardCalculate the mean for Study Hours and Test Scores. Compute the covariance between the two variables using the formula: Calculate the standard deviation for Study Hours (X) and Test Scores (Y). Determine the correlation coefficient Interpret the results: What does the calculated r-value indicate about the relationship between study hours and test scores?arrow_forward
- For unemployed persons in the United States, the average number of months of unemployment at the end of December 2009 was approximately seven months (Bureau of Labor Statistics, January 2010). Suppose the following data are for a particular region in upstate New York. The values in the first column show the number of months unemployed and the values in the second column show the corresponding number of unemployed persons. Months Unemployed Number Unemployed 1 1029 2 1686 3 2269 4 2675 5 3487 6 4652 7 4145 8 3587 9 2325 10 1120 Let x be a random variable indicating the number of months a person is unemployed. a. Use the data to develop an empirical discrete probability distribution for x (to 4 decimals). (x) f(x) 1 2 3 4 5 6 7 8 9 10 b. Show that your probability distribution satisfies the conditions for a valid discrete probability distribution. The input in the box below will not be graded, but may be reviewed and considered by your instructor. blank c. What is the probability that a…arrow_forwardWest Virginia has one of the highest divorce rates in the nation, with an annual rate of approximately 5 divorces per 1000 people (Centers for Disease Control and Prevention website, January 12, 2012). The Marital Counseling Center, Inc. (MCC) thinks that the high divorce rate in the state may require them to hire additional staff. Working with a consultant, the management of MCC has developed the following probability distribution for x = the number of new clients for marriage counseling for the next year. Excel File: data05-19.xls x 10 f(x) .05 20 30 .10 .10 40 .20 50 60 .35 .20 a. Is this probability distribution valid? - Select your answer- Explain. f(x) Σf(x) Select your answer Select your answer b. What is the probability MCC will obtain more than 30 new clients (to 2 decimals)? c. What is the probability MCC will obtain fewer than 20 new clients (to 2 decimals)? d. Compute the expected value and variance of x. Expected value Variance clients per year squared clients per yeararrow_forwardFor unemployed persons in the United States, the average number of months of unemployment at the end of December 2009 was approximately seven months (Bureau of Labor Statistics, January 2010). Suppose the following data are for a particular region in upstate New York. The values in the first column show the number of months unemployed and the values in the second column show the corresponding number of unemployed persons. Months Unemployed Number Unemployed 1 1029 2 1686 3 2269 4 2675 5 3487 6 4652 7 4145 8 3587 9 2325 10 1120 Let x be a random variable indicating the number of months a person is unemployed. a. Use the data to develop an empirical discrete probability distribution for x (to 4 decimals). (x) f(x) 1 2 3 4 5 6 7 8 9 10 b. Show that your probability distribution satisfies the conditions for a valid discrete probability distribution. The input in the box below will not be graded, but may be reviewed and considered by your instructor. c. What is the probability that a person…arrow_forward
 Glencoe Algebra 1, Student Edition, 9780079039897...AlgebraISBN:9780079039897Author:CarterPublisher:McGraw Hill
 Big Ideas Math A Bridge To Success Algebra 1: Stu...AlgebraISBN:9781680331141Author:HOUGHTON MIFFLIN HARCOURTPublisher:Houghton Mifflin Harcourt
 Holt Mcdougal Larson Pre-algebra: Student Edition...AlgebraISBN:9780547587776Author:HOLT MCDOUGALPublisher:HOLT MCDOUGAL
 Linear Algebra: A Modern IntroductionAlgebraISBN:9781285463247Author:David PoolePublisher:Cengage Learning
 Elementary Linear Algebra (MindTap Course List)AlgebraISBN:9781305658004Author:Ron LarsonPublisher:Cengage Learning