
Concept explainers
Videos
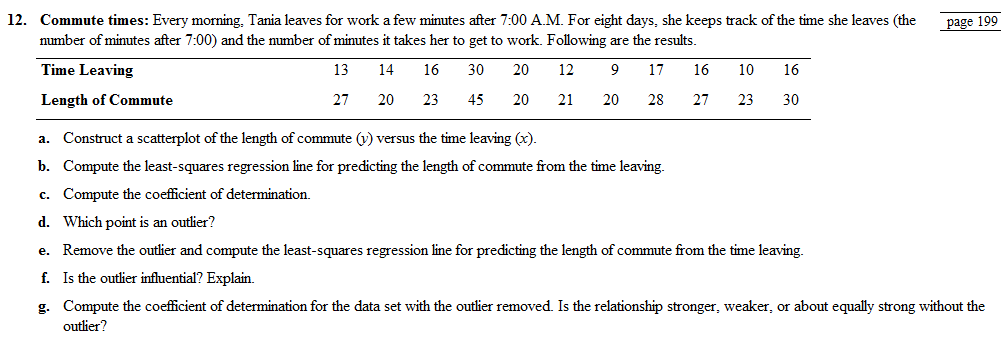
Commute times: Every morning, Tania leaves for work a few minutes after 7:00 A.M. For eight days, she keeps track of the time she leaves (the number of minutes after 7:00) and the number of minutes it takes her to get to work. Following are the results.
- Construct a
scatterplot of the length of commute (y) versus the time leaving (x). - Compute the least-squares regression line for predicting the length of commute from the time leaving.
- Compute the coefficient of determination.
- Which point is an outlier?
- Remove the outlier and compute the least-squares regression line for predicting the length of commute from the time leaving.
- Is the outlier influential? Explain.
- Compute the coefficient of determination for the data set with the outlier removed. Is the relationship stronger. weaker; or about equally strong without the outlier?
a.
To Graph:a scatter plot using the length of commute time
Explanation of Solution
Given information: T leaves her home every day few minutes after
Graph:The scatter plot shows the number of minutes after
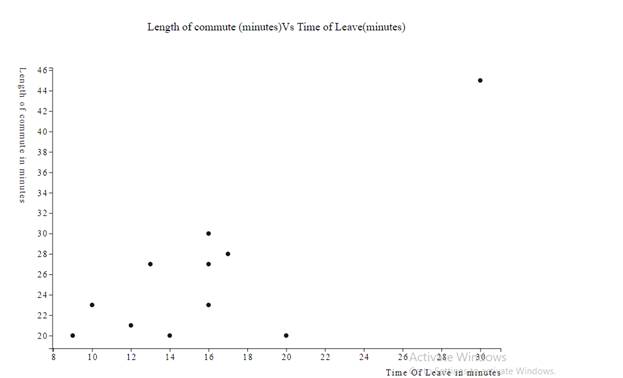
Interpretation:Each of the data in the table contributes an ordered pair of the form (number of minutes after
We use a scatter plot for this example because to understand the relationship between the two variables as ordered pairs it is useful. The points tend to cluster around the straight line. Therefore, we conclude that the variable on the
Now consider the three points
Therefore, we conclude that the variable on the
Because for positive linear relationship the large value of data associates with large values of data in the plot, while for negative linear relationship the large value of data associates with small values of data in the pot. And in this case, it is difficult to say that because the large values of data associate with both small and large and small values of data associate with both small and large at the same time.
Therefore it is good to measure how strong the linear relationship is, to know this we can calculate the correlation coefficient.
b.
To Calculate: the least square regression line
Answer to Problem 12RE
When two variables have a linear relationship, the points on a scatter plot tend to cluster around a straight line called the least square regression line. It is simplified to be
Explanation of Solution
Given information: T leaves her home every day few minutes after
Formulas Used:
Sample mean:
Sample variance:
Correlation Coefficient:
The least-square regression line:
Calculation: Using the below table for calculation.
The sample means and the sample variances can be calculated as shown.
Now, one can use these to calculate the correlation coefficient as shown.
Finally, to calculate the least square regression line as shown, theser can be used.
Where
c.
To Calculate: the coefficient of determination
Answer to Problem 12RE
The coefficient of determination is
Explanation of Solution
Given information: T leaves her home every day few minutes after
Formulas Used:
Sample mean:
Sample variance:
Correlation Coefficient:
Calculation: the correlation coefficient can be calculated as shown by using the formula.
The correlation coefficient
indicates a positive linear association. Here the value of the correlation coefficient close to zero.
Therefore, one can conclude that the positive linear relationship is weak.
Also,
To calculate the coefficient of determination we need to square the correlation coefficient.
Therefore, the coefficient of determination is
d.
To Find: the outlier point
Explanation of Solution
Given information: Tania leaves her home every day few minutes after
Graph: The scatter plot shows the number of minutes after
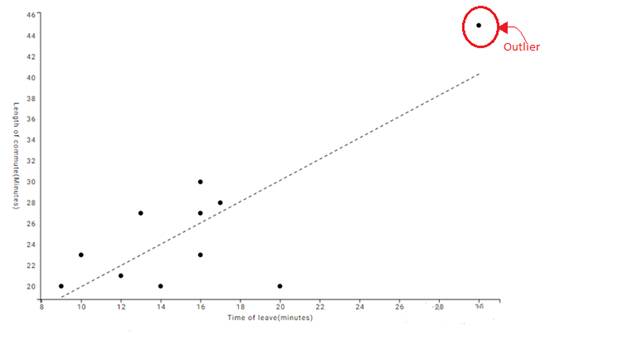
Interpretation: An outlier is a value that considerably larger or considerably smaller than most of the values in a data set. It may be resulting from an error in the process of sampling.
So in the given data set, an outlier point can be detected in the ordered pair
Because it is much larger than the other ordered pairs.
e.
To Calculate: the least square regression line without the outlier point.
Answer to Problem 12RE
The least square regression line without theoutlier point is
Explanation of Solution
Given information: T leaves her home every day few minutes after
Formulas Used:
Sample mean:
Sample variance:
Correlation Coefficient:
The least square regression line:
Calculation: the sample means and the sample variances can be calculated as shown without the outlier point.
Now, one can use these to calculate the correlation coefficient without the outlier as shown.
Finally, one can use these to calculate the least square regression line as shown.
Where
f.
To Show: the outlier is influential
Answer to Problem 12RE
No, the outlier is not that much influential.
Explanation of Solution
Given information: T leaves her home every day few minutes after
The least-square regression line with the outlier is
The least-square regression line without the outlier is
The two least square regression lines are so much close and have no huge difference.
Therefore we can conclude that the outlier is not that much influential. Here, the outlier cannot be a result of an error. It is just random data measured along with the other data in the sampling process.
g.
To Find: the coefficient of determination without the outlier and discuss its strength.
Answer to Problem 12RE
Coefficient of determination is
Explanation of Solution
Given information: T leaves her home every day few minutes after
Formula Used:Sample mean:
Sample variance:
Correlation Coefficient:
Calculation: to calculate the correlation coefficient without the outlier as shown.
The correlation coefficient
indicates a positive linear association. It is
The value is so close to zero .because of the ten to the power is minus thirty-one.
Therefore, one can conclude that the positive linear relationship is very weak without the outlier.
Also,
One can calculate the coefficient of determination by squaring the correlation coefficient.
Therefore, the coefficient of determination is
Want to see more full solutions like this?
Chapter 4 Solutions
Connect Hosted by ALEKS Access Card or Elementary Statistics


- Apply STATA commands & submit the output for each question only when indicated below i. Generate the log of birthweight and family income of children. Name these new variables Ibwght & Ifaminc. Include the output of this code. ii. Apply the command sum with the detail option to the variable faminc. Note: you should find the 25th percentile value, the 50th percentile and the 75th percentile value of faminc from the output - you will need it to answer the next question Include the output of this code. iii. iv. Use the output from part ii of this question to Generate a variable called "high_faminc" that takes a value 1 if faminc is less than or equal to the 25th percentile, it takes the value 2 if faminc is greater than 25th percentile but less than or equal to the 50th percentile, it takes the value 3 if faminc is greater than 50th percentile but less than or equal to the 75th percentile, it takes the value 4 if faminc is greater than the 75th percentile. Include the outcome of this code…arrow_forwardsolve this on paperarrow_forwardApply STATA commands & submit the output for each question only when indicated below i. Apply the command egen to create a variable called "wyd" which is the rowtotal function on variables bwght & faminc. ii. Apply the list command for the first 10 observations to show that the code in part i worked. Include the outcome of this code iii. Apply the egen command to create a new variable called "bwghtsum" using the sum function on variable bwght by the variable high_faminc (Note: need to apply the bysort' statement) iv. Apply the "by high_faminc" statement to find the V. descriptive statistics of bwght and bwghtsum Include the output of this code. Why is there a difference between the standard deviations of bwght and bwghtsum from part iv of this question?arrow_forward
- According to a health information website, the distribution of adults’ diastolic blood pressure (in millimeters of mercury, mmHg) can be modeled by a normal distribution with mean 70 mmHg and standard deviation 20 mmHg. b. Above what diastolic pressure would classify someone in the highest 1% of blood pressures? Show all calculations used.arrow_forwardWrite STATA codes which will generate the outcomes in the questions & submit the output for each question only when indicated below i. ii. iii. iv. V. Write a code which will allow STATA to go to your favorite folder to access your files. Load the birthweight1.dta dataset from your favorite folder and save it under a different filename to protect data integrity. Call the new dataset babywt.dta (make sure to use the replace option). Verify that it contains 2,998 observations and 8 variables. Include the output of this code. Are there missing observations for variable(s) for the variables called bwght, faminc, cigs? How would you know? (You may use more than one code to show your answer(s)) Include the output of your code (s). Write the definitions of these variables: bwght, faminc, male, white, motheduc,cigs; which of these variables are categorical? [Hint: use the labels of the variables & the browse command] Who is this dataset about? Who can use this dataset to answer what kind of…arrow_forwardApply STATA commands & submit the output for each question only when indicated below İ. ii. iii. iv. V. Apply the command summarize on variables bwght and faminc. What is the average birthweight of babies and family income of the respondents? Include the output of this code. Apply the tab command on the variable called male. How many of the babies and what share of babies are male? Include the output of this code. Find the summary statistics (i.e. use the sum command) of the variables bwght and faminc if the babies are white. Include the output of this code. Find the summary statistics (i.e. use the sum command) of the variables bwght and faminc if the babies are male but not white. Include the output of this code. Using your answers to previous subparts of this question: What is the difference between the average birthweight of a baby who is male and a baby who is male but not white? What can you say anything about the difference in family income of the babies that are male and male…arrow_forward
- A public health researcher is studying the impacts of nudge marketing techniques on shoppers vegetablesarrow_forwardThe director of admissions at Kinzua University in Nova Scotia estimated the distribution of student admissions for the fall semester on the basis of past experience. Admissions Probability 1,100 0.5 1,400 0.4 1,300 0.1 Click here for the Excel Data File Required: What is the expected number of admissions for the fall semester? Compute the variance and the standard deviation of the number of admissions. Note: Round your standard deviation to 2 decimal places.arrow_forwardA pollster randomly selected four of 10 available people. Required: How many different groups of 4 are possible? What is the probability that a person is a member of a group? Note: Round your answer to 3 decimal places.arrow_forward
- Wind Mountain is an archaeological study area located in southwestern New Mexico. Potsherds are broken pieces of prehistoric Native American clay vessels. One type of painted ceramic vessel is called Mimbres classic black-on-white. At three different sites the number of such sherds was counted in local dwelling excavations. Test given. Site I Site II Site III 63 19 60 43 34 21 23 49 51 48 11 15 16 46 26 20 31 Find .arrow_forwardRothamsted Experimental Station (England) has studied wheat production since 1852. Each year many small plots of equal size but different soil/fertilizer conditions are planted with wheat. At the end of the growing season, the yield (in pounds) of the wheat on the plot is measured. Suppose for a random sample of years, one plot gave the following annual wheat production (in pounds): 4.46 4.21 4.40 4.81 2.81 2.90 4.93 3.54 4.16 4.48 3.26 4.74 4.97 4.02 4.91 2.59 Use a calculator to verify that the sample variance for this plot is . Another random sample of years for a second plot gave the following annual wheat production (in pounds): 3.89 3.81 3.95 4.07 4.01 3.73 4.02 3.78 3.72 3.96 3.62 3.76 4.02 3.73 3.94 4.03 Use a calculator to verify that the sample variance for this plot is . Suppose that we test the claim using that the population variance of annual wheat production for the first plot is larger…arrow_forwardIt is thought that prehistoric Native Americans did not take their best tools, pottery, and household items when they visited higher elevations for their summer camps. It is hypothesized that archaeological sites tend to lose their cultural identity and specific cultural affiliation as the elevation of the site increases. Let x be the elevation (in thousands of feet) for an archaeological site in the southwestern United States. Let y be the percentage of unidentified artifacts (no specific cultural affiliation) at a given elevation. Suppose that the following data were obtained for a collection of archaeological sites in New Mexico: x 5.50 6.00 6.75 7.00 7.75 y 37 38 92 70 99 Find the equation of the least squares line . Round a and b to three decimal places.arrow_forward
 College AlgebraAlgebraISBN:9781305115545Author:James Stewart, Lothar Redlin, Saleem WatsonPublisher:Cengage Learning
 Elementary Linear Algebra (MindTap Course List)AlgebraISBN:9781305658004Author:Ron LarsonPublisher:Cengage Learning
 Algebra and Trigonometry (MindTap Course List)AlgebraISBN:9781305071742Author:James Stewart, Lothar Redlin, Saleem WatsonPublisher:Cengage Learning
 Functions and Change: A Modeling Approach to Coll...AlgebraISBN:9781337111348Author:Bruce Crauder, Benny Evans, Alan NoellPublisher:Cengage Learning
 Linear Algebra: A Modern IntroductionAlgebraISBN:9781285463247Author:David PoolePublisher:Cengage Learning