
Concept explainers
Videos
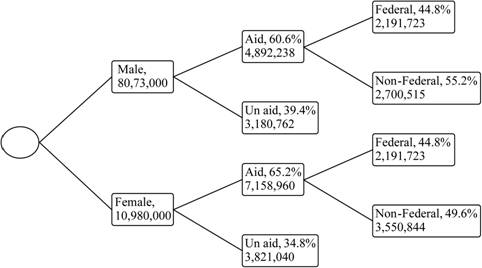
Student Financial Aid In a recent year 8,073,000 male students and 10,980,000 female students were enrolled as undergraduates. Receiving aid were 60.6% of the male students and 65.2% of the female students. Of those receiving aid, 44.8% of the males got federal aid and 50.4% of the females got federal aid. Choose 1 student at random. (Hint: Make a tree diagram.) Find the
a. A male student without aid
b. A male student, given that the student has aid
c. A female student or a student who receives federal aid
Source: www.nces.gov
a.
To find: The probability that the student is a male student without aid.
Answer to Problem 19E
The probability that the student is a male student without aid is 0.167.
Explanation of Solution
Given info:
There is one student is chosen at random. There are 8,073,000 male students and 10,980,000 female students in which aid were 60.6% of the male students and 65.2% of the female students. Of those receiving aid, 44.8% of the males got federal aid and 50.4% of the females got federal aid.
Calculation:
Multiplication rule for dependent events:
If the events A and B are dependent, the probability of occurring of event B is affected by event A, that is
Let event M denote that student is a male and WOA be denote that selecting student has without aids.
Here, there are 8,073,000 male students and 10,980,000 female students.
Also, the tree diagram is shown below:
The frequency for the class is 8,073,000. Also, the total frequency is,
The formula for probability of event M is,
Substitute 8,073,000 for ‘Frequency for the class’ and 19,053,000 for ‘Total frequencies in the distribution’,
Thus, the probability that the student is a male is 0.424.
Also, from the tree diagram it is observed that the probability that the without aid in male students are 0.394.
By applying multiplication rule, the probability that the student is a male student without aid is,
Thus, the probability that the student is a male student without aid is 0.167.
b.
To find: The probability that the student is a male student, given that the student has aid.
Answer to Problem 19E
The probability that the student is a male student, given that the student has aid is 0.406.
Explanation of Solution
Calculation:
Let event F denote that student is a female and WA be denote that selecting student has with aids.
From the part (a), it is observed that the probability that the student is a male student is 0.424then the probability that the student is a female student is 0.576
From, tree diagram it is observed that the probability that the students has aid in males is 0.606 and the probability that the students has aid in females is 0.652.
By applying multiplication rule, the probability that that the student has aid is,
The required probability is,
Then, the probability that the student is a male student and the student has aid is,
Then, the probability that the student is a male student, given that the student has aid is,
Thus, the probability that the student is a male student, given that the student has aid is 0.406.
c.
To find: The probability that the student is a female student or a student who receives federal aid.
Answer to Problem 19E
The probability that the student is a female student or a student who receives federal aid is 0.691.
Explanation of Solution
Calculation:
Let event FA denote that student has federal aid.
From, part (b) it is observed that the student is a female student is 0.576. Also, from tree graph it is observed that the probability that the student has aid in males is 0.606 and in which federal aids are 0.448. Also, the probability that the student has aid in females is 0.652 and in which federal aids are 0.448.
By applying multiplication rule, the probability that the student has federal aid is,
Then, the probability that the student is a female student and the student has federal aid is,
Addition Rule:
The formula for probability of getting event F or event FA is,
Substitute 0.576 for
Thus, the probability that the student is a female student or a student who receives federal aid is 0.691
Want to see more full solutions like this?
Chapter 4 Solutions
Connect hosted by ALEKS Access Card 52-Week for Elementary Statistics: A Step by Step Approach


- Examine the Variables: Carefully review and note the names of all variables in the dataset. Examples of these variables include: Mileage (mpg) Number of Cylinders (cyl) Displacement (disp) Horsepower (hp) Research: Google to understand these variables. Statistical Analysis: Select mpg variable, and perform the following statistical tests. Once you are done with these tests using mpg variable, repeat the same with hp Mean Median First Quartile (Q1) Second Quartile (Q2) Third Quartile (Q3) Fourth Quartile (Q4) 10th Percentile 70th Percentile Skewness Kurtosis Document Your Results: In RStudio: Before running each statistical test, provide a heading in the format shown at the bottom. “# Mean of mileage – Your name’s command” In Microsoft Word: Once you've completed all tests, take a screenshot of your results in RStudio and paste it into a Microsoft Word document. Make sure that snapshots are very clear. You will need multiple snapshots. Also transfer these results to the…arrow_forward2 (VaR and ES) Suppose X1 are independent. Prove that ~ Unif[-0.5, 0.5] and X2 VaRa (X1X2) < VaRa(X1) + VaRa (X2). ~ Unif[-0.5, 0.5]arrow_forward8 (Correlation and Diversification) Assume we have two stocks, A and B, show that a particular combination of the two stocks produce a risk-free portfolio when the correlation between the return of A and B is -1.arrow_forward
- 9 (Portfolio allocation) Suppose R₁ and R2 are returns of 2 assets and with expected return and variance respectively r₁ and 72 and variance-covariance σ2, 0%½ and σ12. Find −∞ ≤ w ≤ ∞ such that the portfolio wR₁ + (1 - w) R₂ has the smallest risk.arrow_forward7 (Multivariate random variable) Suppose X, €1, €2, €3 are IID N(0, 1) and Y2 Y₁ = 0.2 0.8X + €1, Y₂ = 0.3 +0.7X+ €2, Y3 = 0.2 + 0.9X + €3. = (In models like this, X is called the common factors of Y₁, Y₂, Y3.) Y = (Y1, Y2, Y3). (a) Find E(Y) and cov(Y). (b) What can you observe from cov(Y). Writearrow_forward1 (VaR and ES) Suppose X ~ f(x) with 1+x, if 0> x > −1 f(x) = 1−x if 1 x > 0 Find VaRo.05 (X) and ES0.05 (X).arrow_forward
- Joy is making Christmas gifts. She has 6 1/12 feet of yarn and will need 4 1/4 to complete our project. How much yarn will she have left over compute this solution in two different ways arrow_forwardSolve for X. Explain each step. 2^2x • 2^-4=8arrow_forwardOne hundred people were surveyed, and one question pertained to their educational background. The results of this question and their genders are given in the following table. Female (F) Male (F′) Total College degree (D) 30 20 50 No college degree (D′) 30 20 50 Total 60 40 100 If a person is selected at random from those surveyed, find the probability of each of the following events.1. The person is female or has a college degree. Answer: equation editor Equation Editor 2. The person is male or does not have a college degree. Answer: equation editor Equation Editor 3. The person is female or does not have a college degree.arrow_forward
 College Algebra (MindTap Course List)AlgebraISBN:9781305652231Author:R. David Gustafson, Jeff HughesPublisher:Cengage Learning
 Holt Mcdougal Larson Pre-algebra: Student Edition...AlgebraISBN:9780547587776Author:HOLT MCDOUGALPublisher:HOLT MCDOUGAL
 Glencoe Algebra 1, Student Edition, 9780079039897...AlgebraISBN:9780079039897Author:CarterPublisher:McGraw Hill
 College AlgebraAlgebraISBN:9781305115545Author:James Stewart, Lothar Redlin, Saleem WatsonPublisher:Cengage Learning