
Videos
Average Monthly Temperature The average monthly temperature (in °F) in Seattle. Washington, is shown in the table.
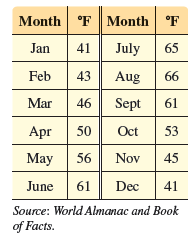
(a) Plot the average monthly temperature over a two-year period, letting x = 1 correspond to January of the first year. Do the data seem to indicate a translated sine graph?
(b) The highest average monthly temperature is 66°F in August, and the lowest average monthly temperature is 41°F in January. Their average is 53.5°F. Graph the data together with the line y = 53.5. What docs this line represent with regard to temperature in Seattle?
(c) Approximate the amplitude, period, and phase shift of the translated sine wave.
(d) Determine a
(e) Graph f together with the data on the same coordinate axes. How well docs f model the given data?
(f) Use the sine regression capability of a graphing calculator to find the equation of a sine curve that fits these data.
Want to see the full answer?
Check out a sample textbook solution
Chapter 4 Solutions
Trigonometry (11th Edition)


- 2. If log2 (sin x) + log₂ (cos x) = -2 and log2 (sin x + cos x) = (-2 + log2 n), find n.arrow_forwardIf cscx- cotx = -4, find cscx + cotx.arrow_forwardQuestion 10 (5 points) (07.04 MC) Vectors u and v are shown in the graph. -12-11 -10 -9 -8 -7 -6 -5 What is proju? a -6.5i - 4.55j b -5.2i+2.6j с -4.7631 3.334j d -3.81i+1.905j < + 10 6 5 4 3 2 -3 -2 -10 1 -1 -2 -3 u -4 -5 -6 -7arrow_forward
- Find the lengths of PR and OR in terms of the angles α and β. Find the angles ∠ONQ and ∠NPQ. Find the lengths of ON and PN in terms of the angle β. Find the length of PQ. Find the length of QR. Find the length of OM. Find the length of RM. What formula can you write down by noting that PR = QR + PQ? What formula can you write down by noting that OR = OM - RM?arrow_forward5) Solve the triangle. 2 95° 4 B с A) c=3.63, A=59.5°, B = 25.5° C) c = 4.63, A = 59.5°, B = 25.5° A B) c 4.63, A 25.5°, B = 59.5° = = D) c 5.63, A = 25.5°, B = 59.5°arrow_forwardFind zw. Leave your answer in polar form. = လ 3π 2 z = 6 cos 6 cos 37 3π + i sin 2 57 W = 12 cos + i sin 6 6 ༠།ལྦ་arrow_forward
- 10 Write the expression (1 – i) i)in the standard form a + bi.arrow_forward11) The letters r and 0 represent polar coordinates. Write the equation r sine = 10 using rectangular coordinates (x, y). A) x = 10y B) y = 10 C) x = 10 D) y = 10xarrow_forward18) Find all the complex cube roots of - 8i. Leave your answers in polar form with the argument in degrees.arrow_forward
- Write the complex number √3 - i in polar form.arrow_forward2 10) The letters x and y represent rectangular coordinates. Write the equation x² + 4y = 4 using polar coordinates (r, e). A) 4 cos² 0 + sin² 0 = 4r C) r²(4 cos² 0 + sin² 0) = 4 B) cos² 0 + 4 sin² 0 = 4r D) r² (cos20 + 4 sin² 0) = 4arrow_forward2) A radio transmission tower is 130 feet tall. How long should a guy wire be if it is to be attached 6 feet from the top and is to make an angle of 20° with the ground? Give your answer to the nearest tenth of a foot.arrow_forward
 Algebra & Trigonometry with Analytic GeometryAlgebraISBN:9781133382119Author:SwokowskiPublisher:Cengage
 Trigonometry (MindTap Course List)TrigonometryISBN:9781337278461Author:Ron LarsonPublisher:Cengage Learning
 Holt Mcdougal Larson Pre-algebra: Student Edition...AlgebraISBN:9780547587776Author:HOLT MCDOUGALPublisher:HOLT MCDOUGAL
 Trigonometry (MindTap Course List)TrigonometryISBN:9781305652224Author:Charles P. McKeague, Mark D. TurnerPublisher:Cengage Learning
 College Algebra (MindTap Course List)AlgebraISBN:9781305652231Author:R. David Gustafson, Jeff HughesPublisher:Cengage Learning